There are interesting set-ups in the Dow, gold and British pound according to John Rawlins’ QuantCycle Indicator.
The QuantCycle Indicator has several interesting short- and medium-term set-ups at the end of January.
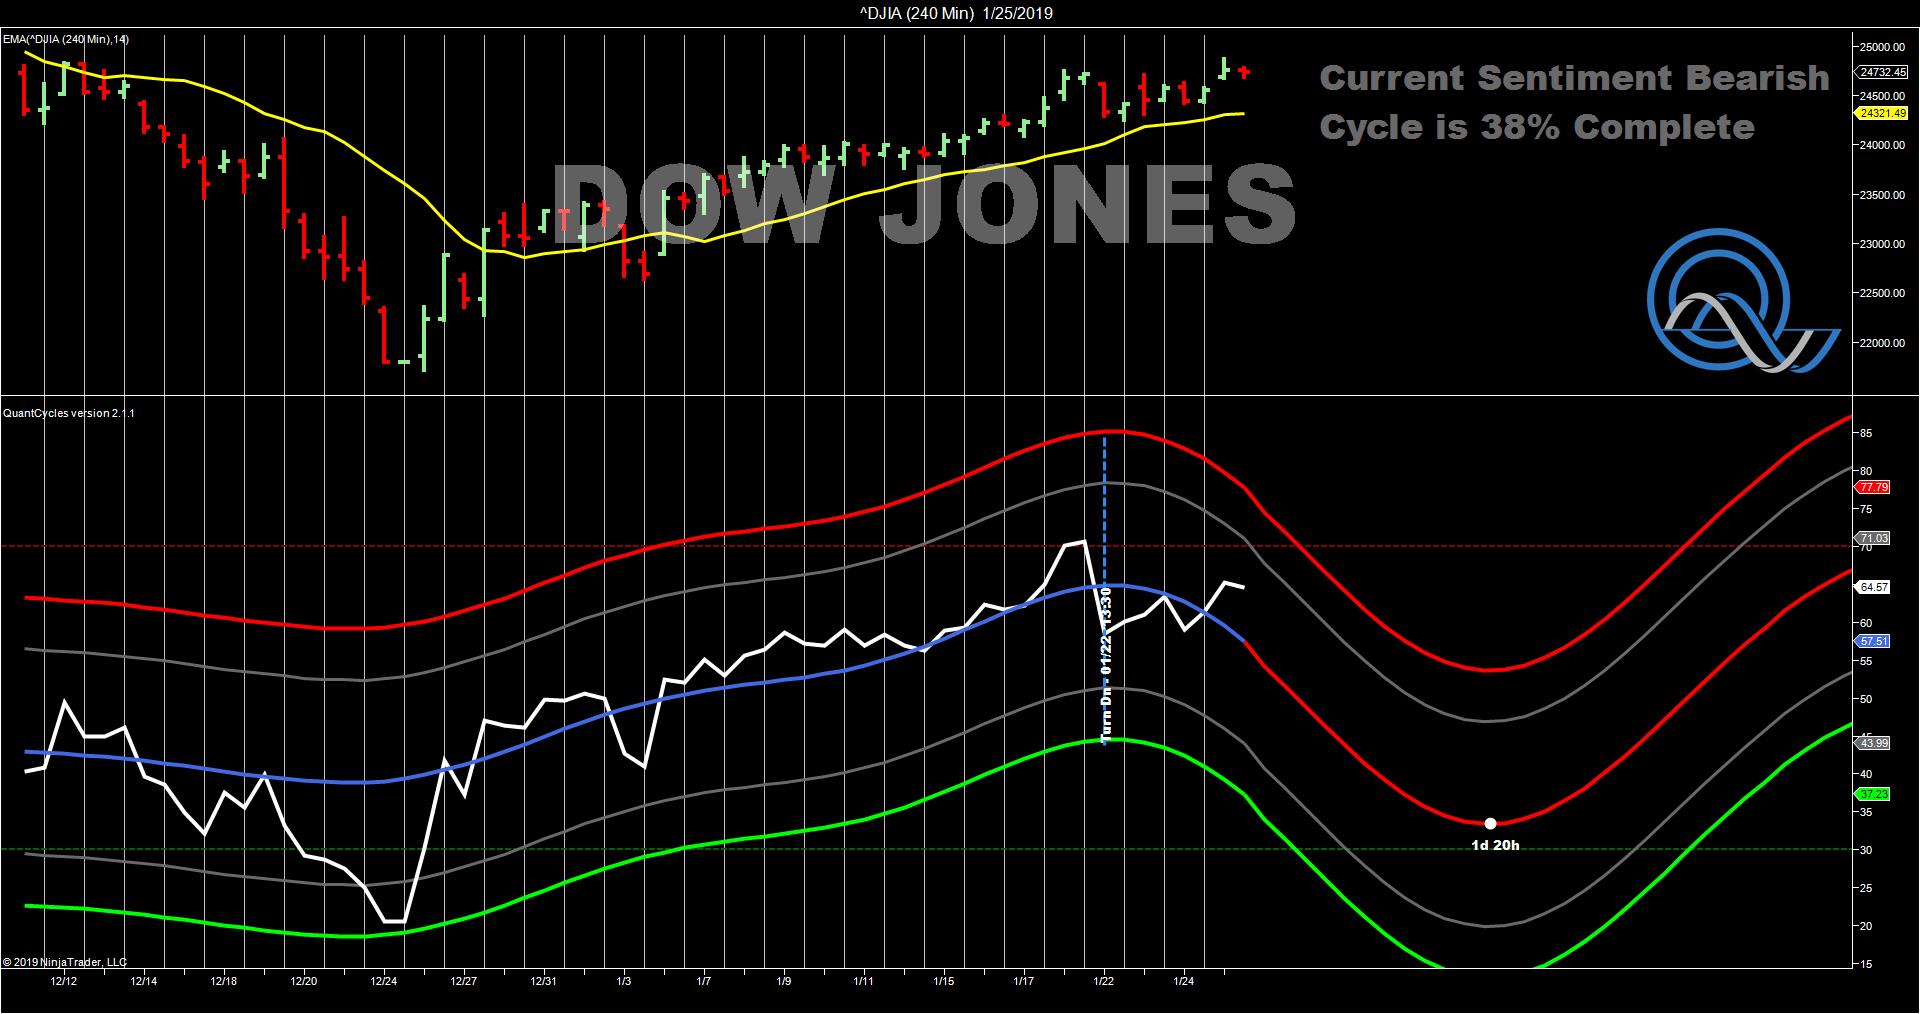
A week ago we pointed out how the QuantCycle was showing weakness across all of the major stock indices. Currently the 240-minute QuantCycle is showing that the Dow Jones Index is approaching overbought territory as it projects a downturn early this week.
Gold
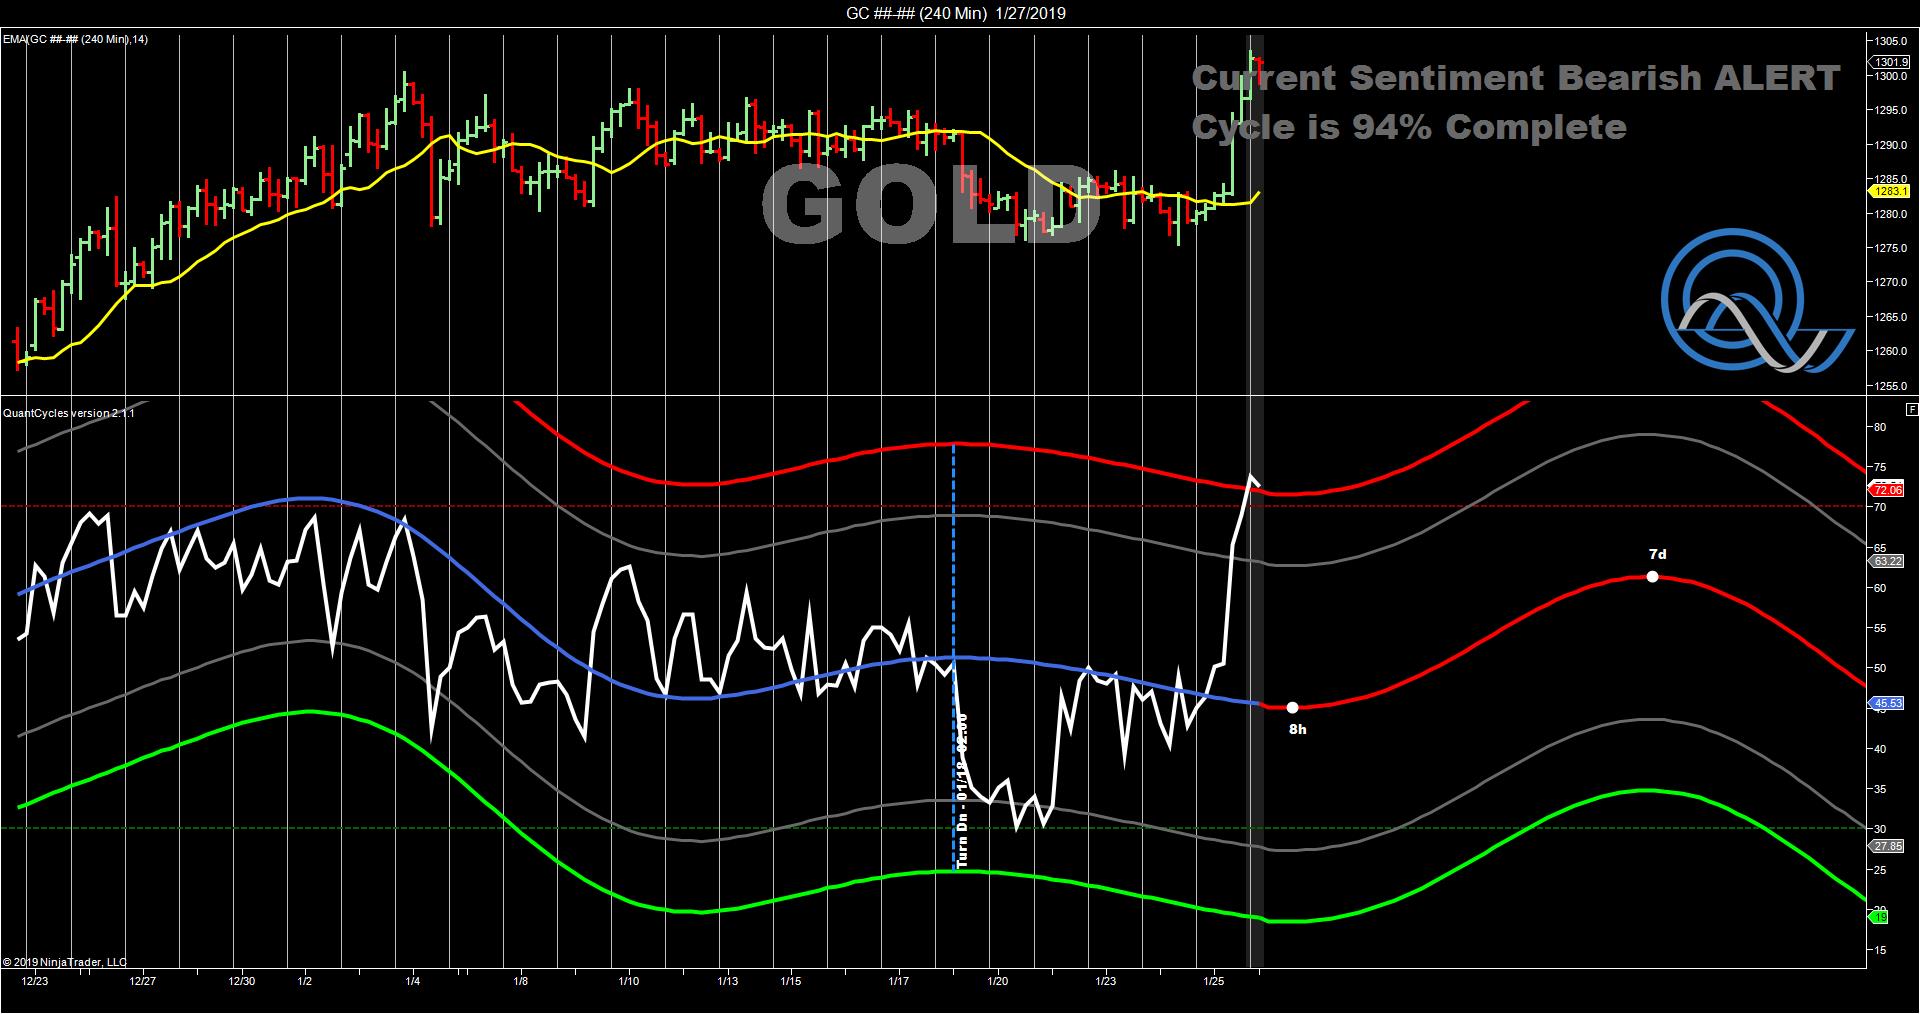
Last week’s rally in gold has moved the shiny metal into overbought territory on the QuantCycle. This could be a selling opportunity, but the QuantCycle for gold is relatively flat this week and is followed by an upturn. Traders could view any weakness in the week as a buying opportunity. You may consider a short-term show. However, if you remain bullish, you will want to see gold come off the highs of last week before initiating any buys.
Forex
BAC Fights off bearish outlook
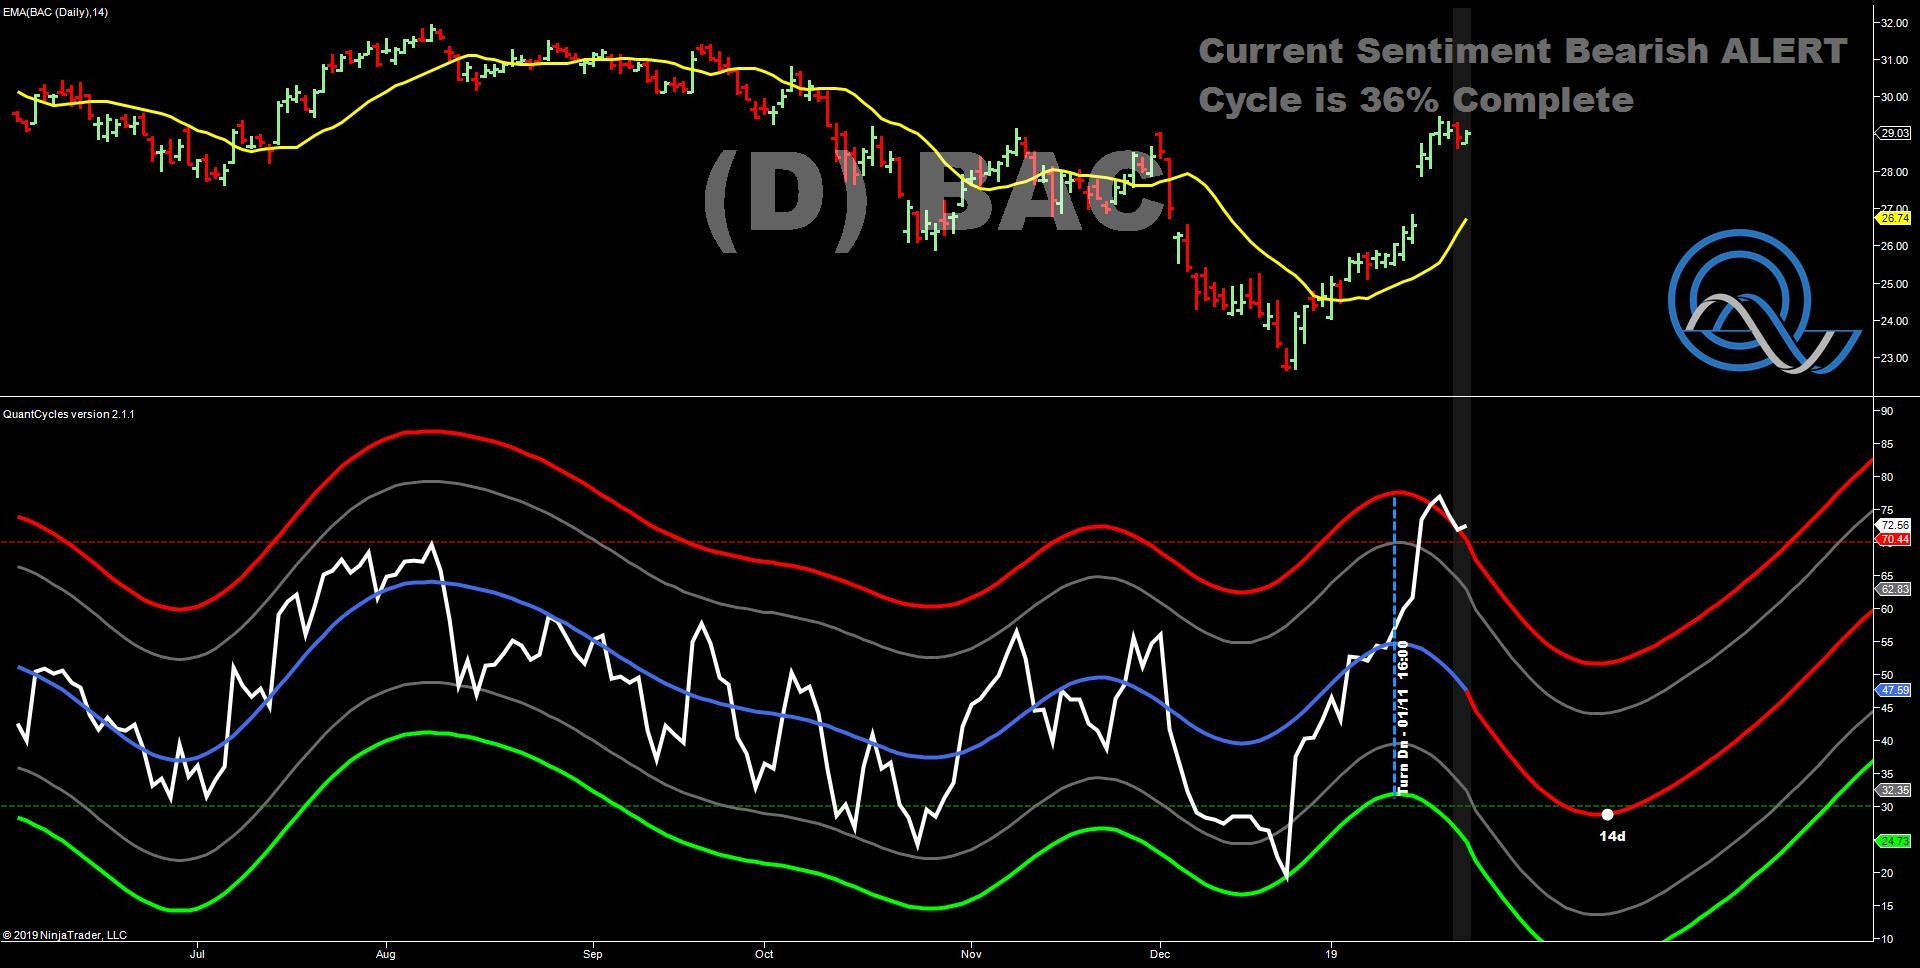
On Jan. 17 we posted an alert showing that Bank of America (BAC) had entered extreme overbought territory following its most recent earnings announcement. BAC has continued to show strength despite this bearish cyclical outlook. Currently BAC remains in overbought territory with the QuantCycle showing it is ready for a sell-off.
Forex
There are several interesting longer-term potential moves in the currency sector. The EUR/GBP pair is appears to be extremely oversold, while the QuantCycle is showing a solid uptrend for the next three weeks. This is a strong buy signal in the EUR/GBP.
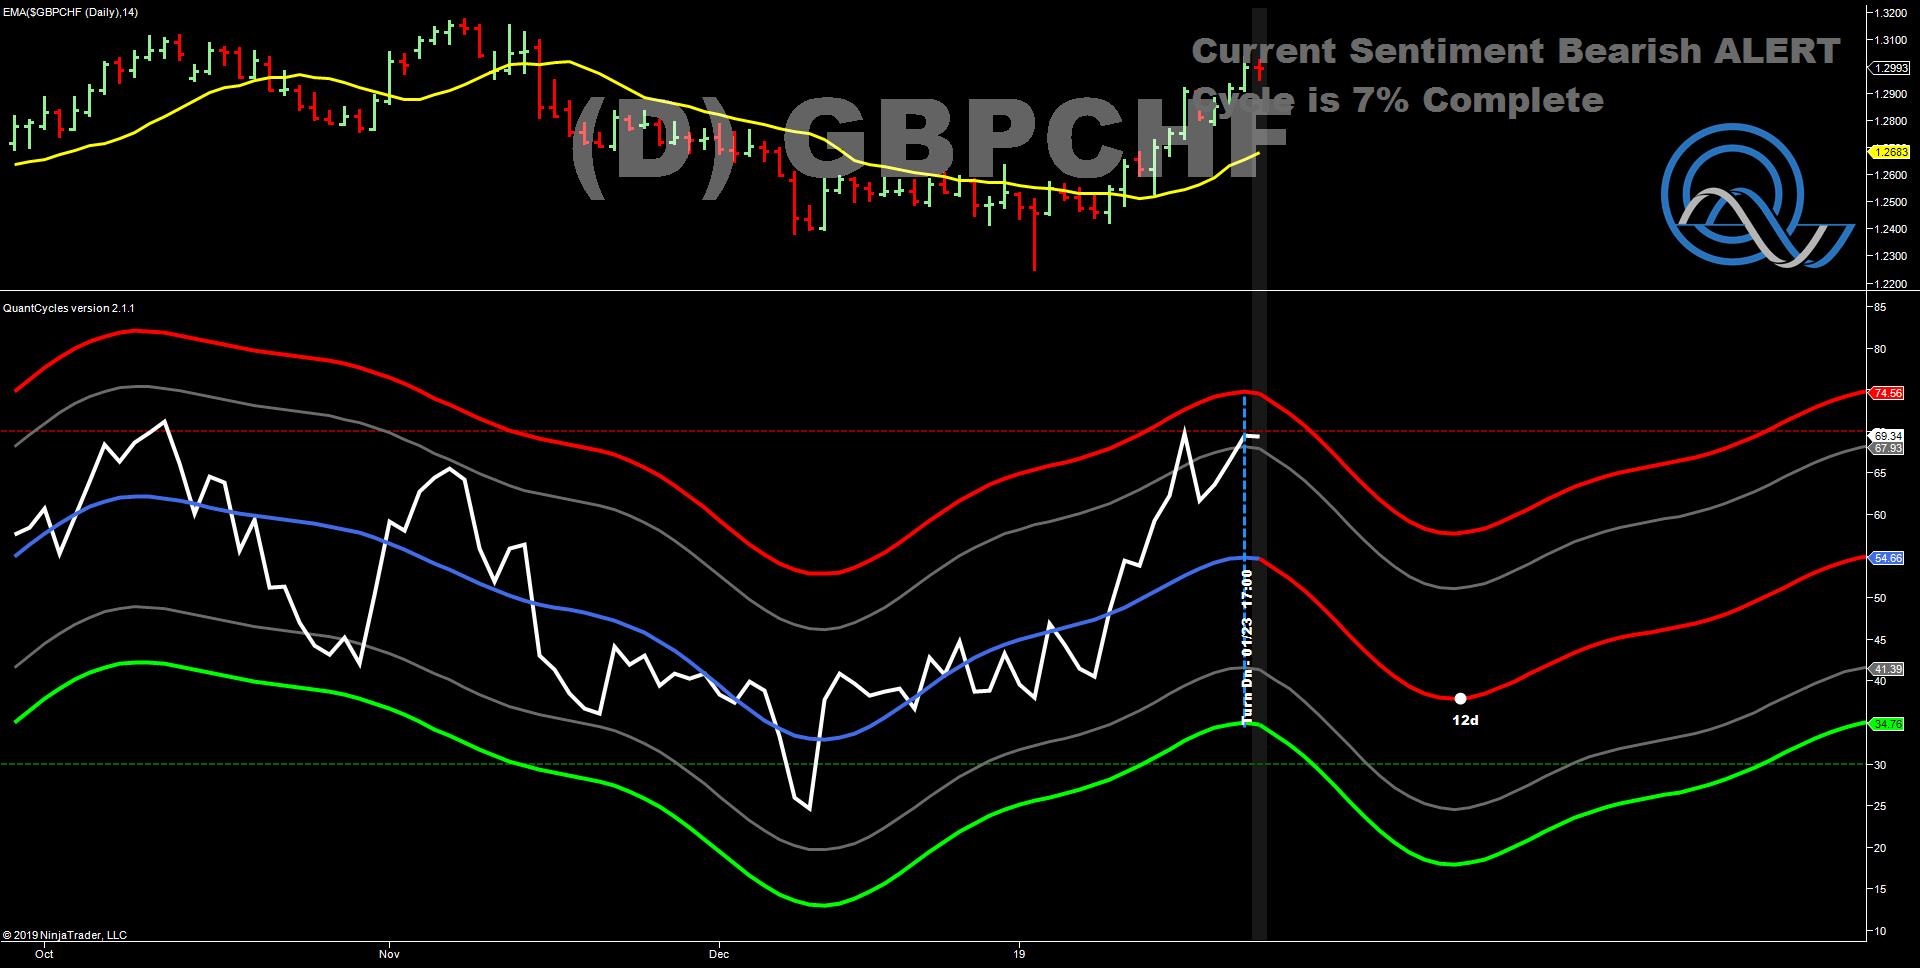
In another pair involving the sterling, the GBP/CHF, the pound is nearing over bought territory vs. the Swiss franc. This with the QuantCycle showing an uptrend for the next two weeks or so. However, the QuantCycle indicates a long uptrend beginning in 10-12 days. Short-term traders may consider selling the pair. Longer-term traders may want to wait on weakness as a potential buying opportunity in mid-February.
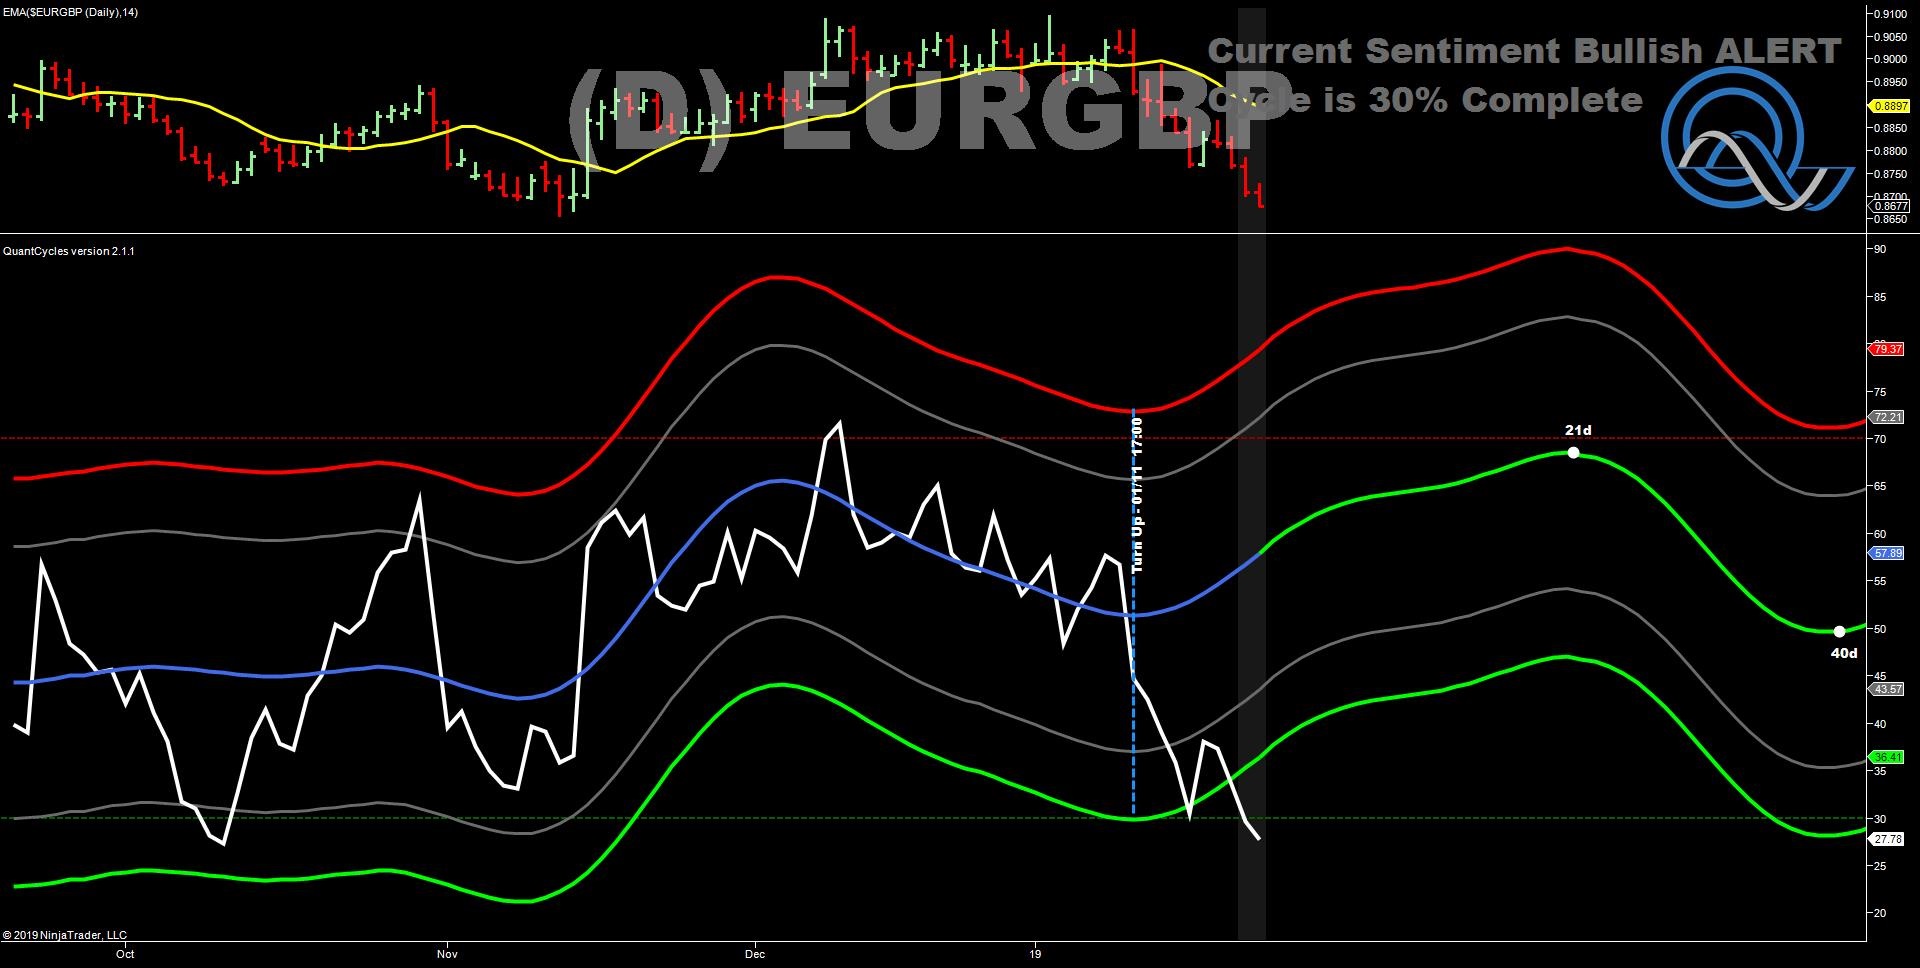
The QuantCycle indicator is a technical tool that employs proprietary statistical techniques and complex algorithms to filter multiple cycles from historical data, combines them to obtain cyclical information from price data and then gives a graphical representation of their predictive behavior (center line forecast). Other proprietary frequency techniques are then employed to obtain the cycles embedded in the prices. The upper and lower bands of the oscillator represent a two-standard deviation move from the predictive price band and are indicative of extreme overbought/oversold conditions.


