John Rawlins’ QuantCycle indicator is showing major moves ahead. Here we share upcoming moves and recent accurate predictions.
QuantCycles is a technical tool that employs proprietary statistical techniques and complex algorithms to filter multiple cycles from historical data, combines them to obtain cyclical information from price data and then gives a graphical representation of their predictive behavior (center line forecast). Other proprietary frequency techniques are then employed to obtain the cycles embedded in the prices.
The upper and lower bands of the oscillator represent a two-standard deviation move from the predictive price band and is indicative of extreme overbought/oversold conditions.
Recent Success
On Dec. 24, the QuantCycle indicated that the CBOE Volatility Index (VIX) have moved firmly into overbought territory, while the cycle still showed the VIX would experience downward momentum (see Chart). This is a major sell signal as the indicator is showing a downward bias just as the VIX is extremely overbought.
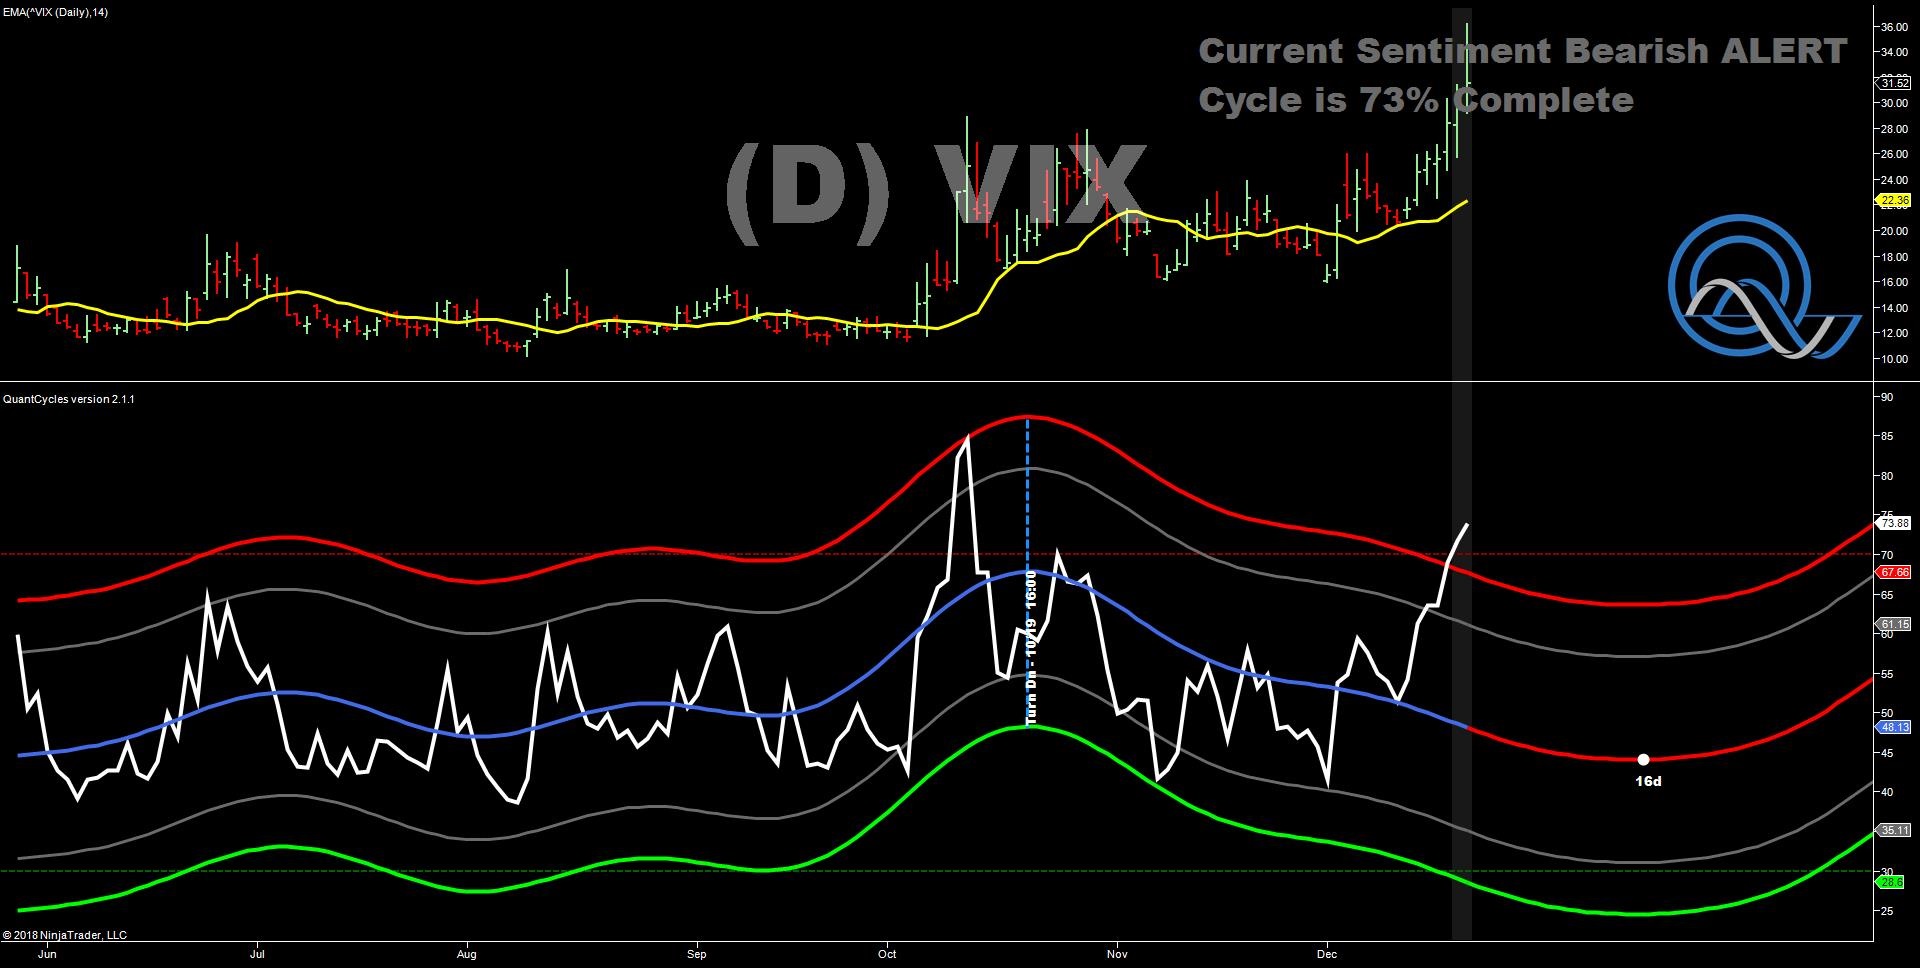
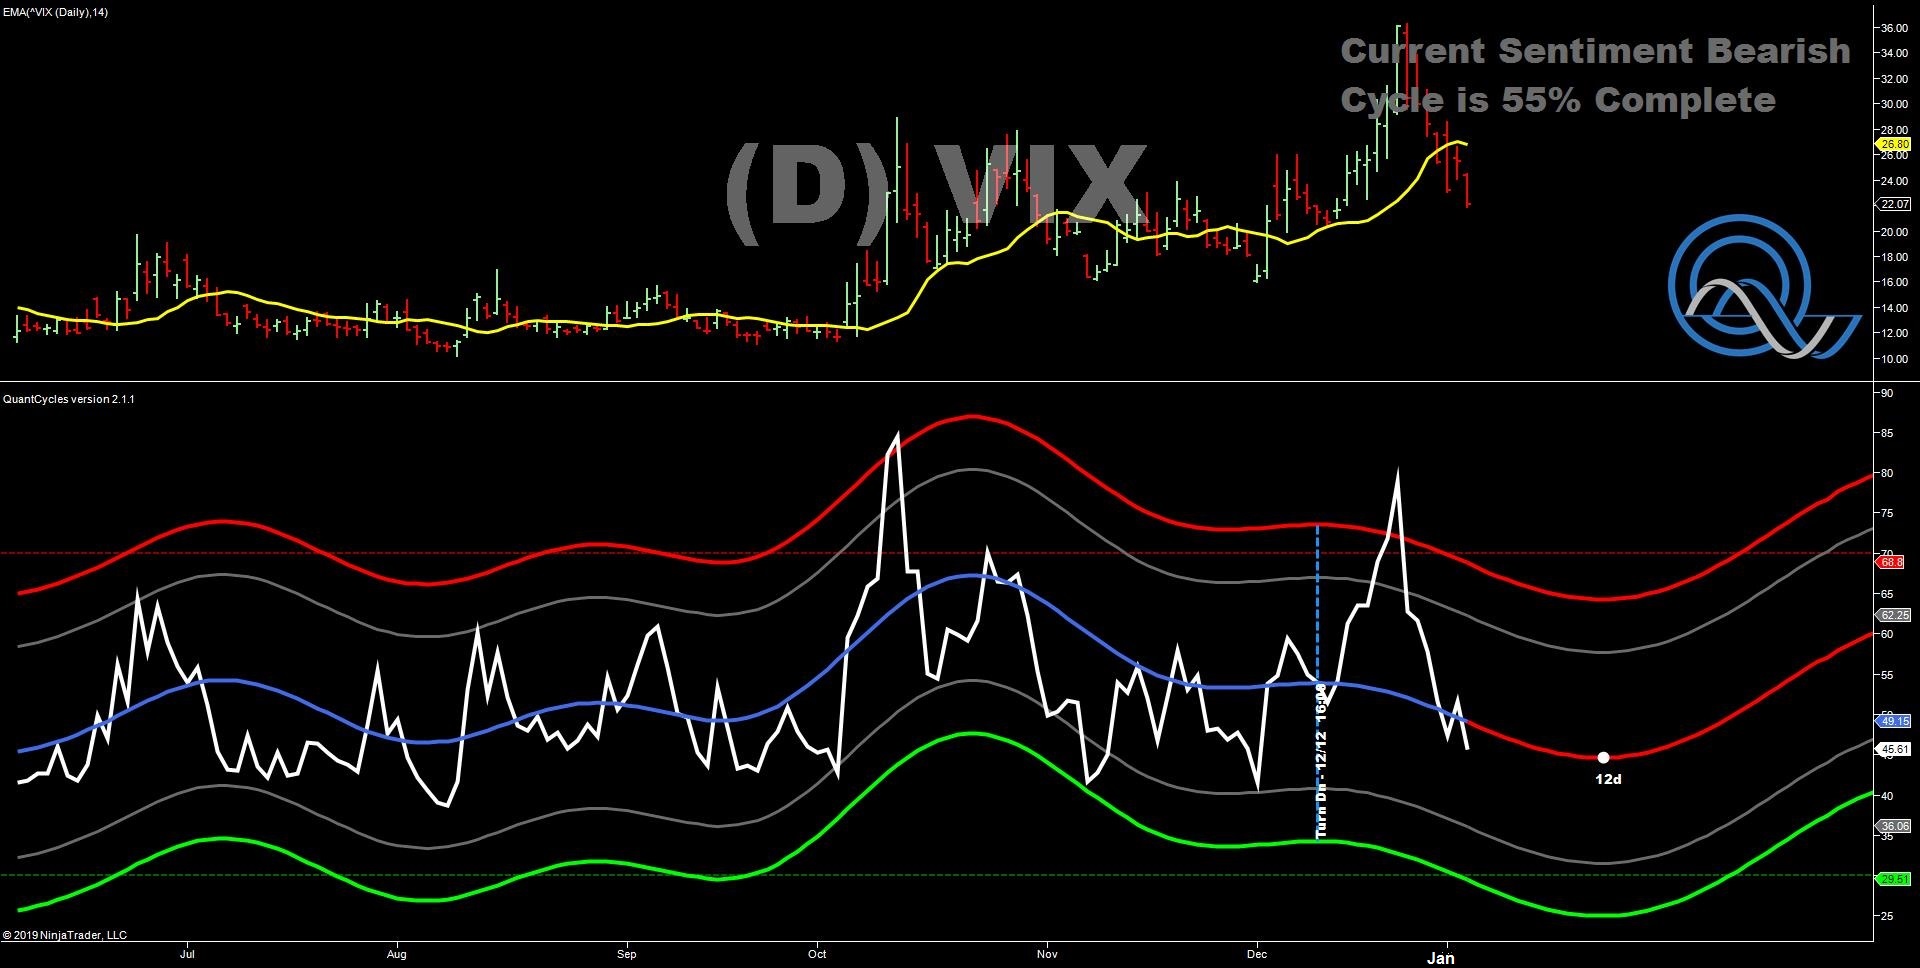
The following chart from Jan. 4 shows how the market reacted in the 10 days following that Dec. 24 bearish outlook.
Dow move
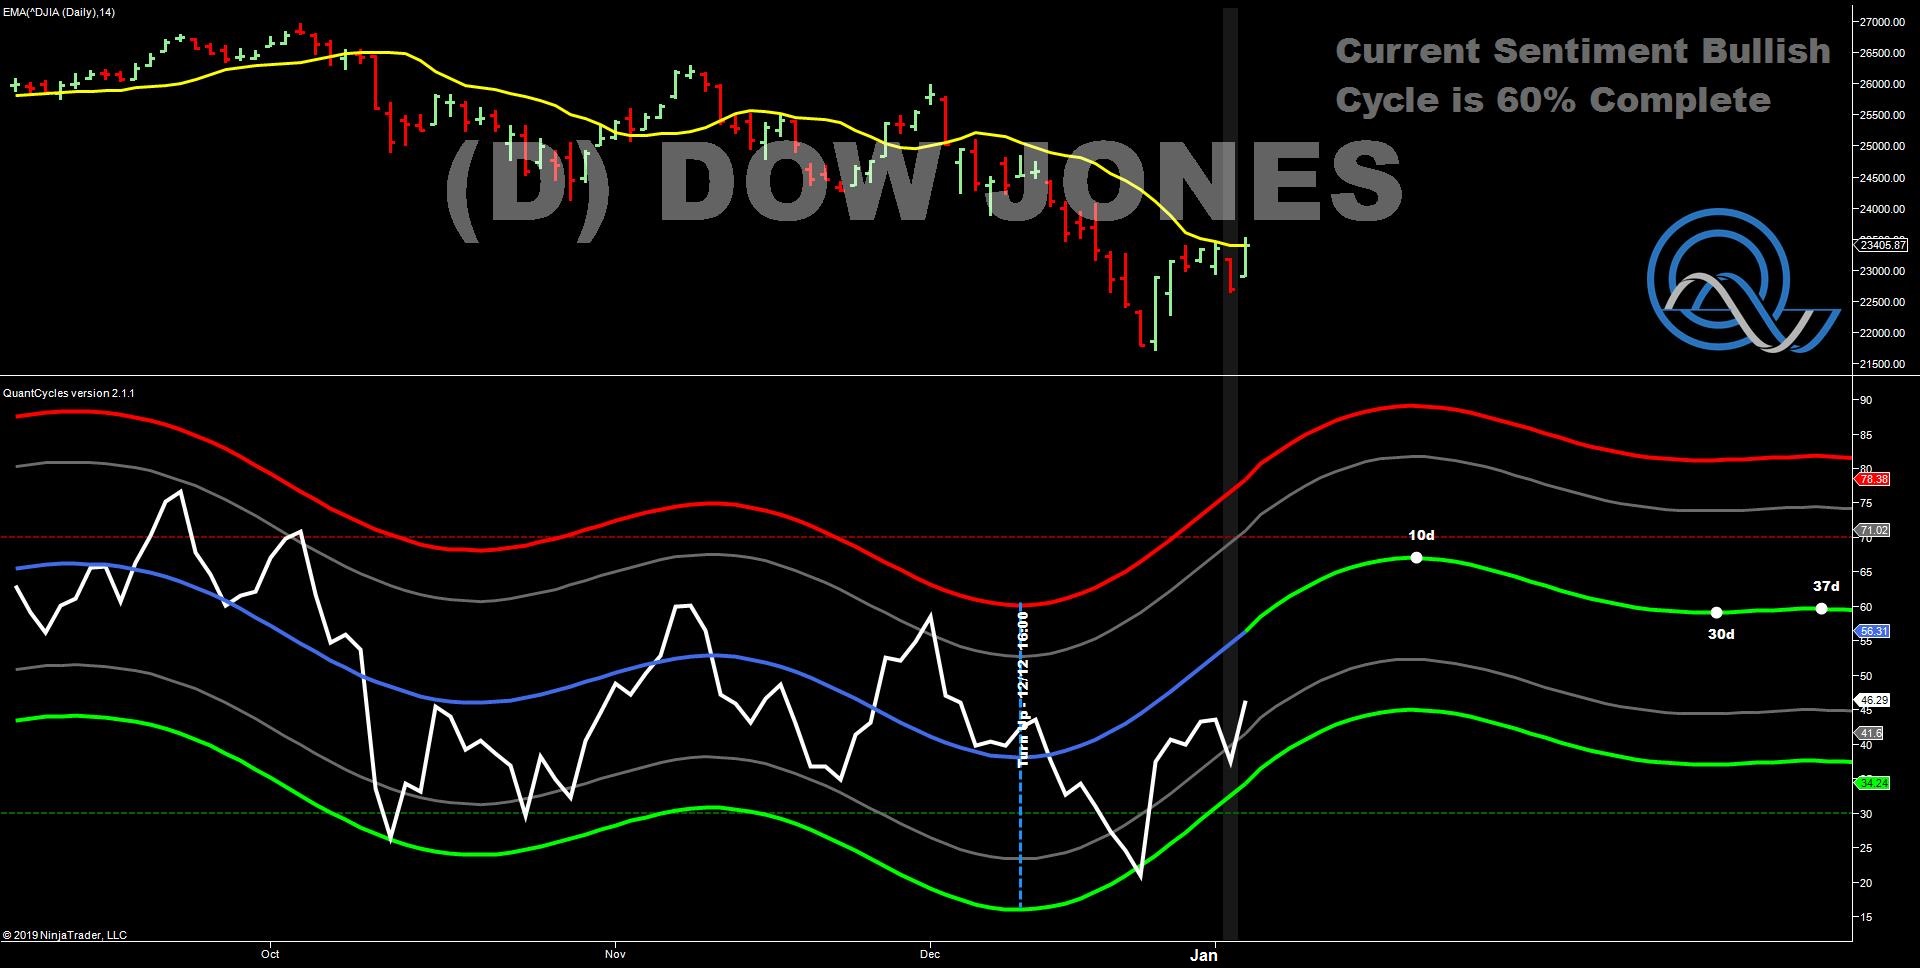
On Dec. 24, the QuantCycle indicated that the Dow Jones Industrial Average bottomed and would be moving higher the following four to six weeks. However, the market continued to weaken, pushing it into extreme oversold territory (see chart).
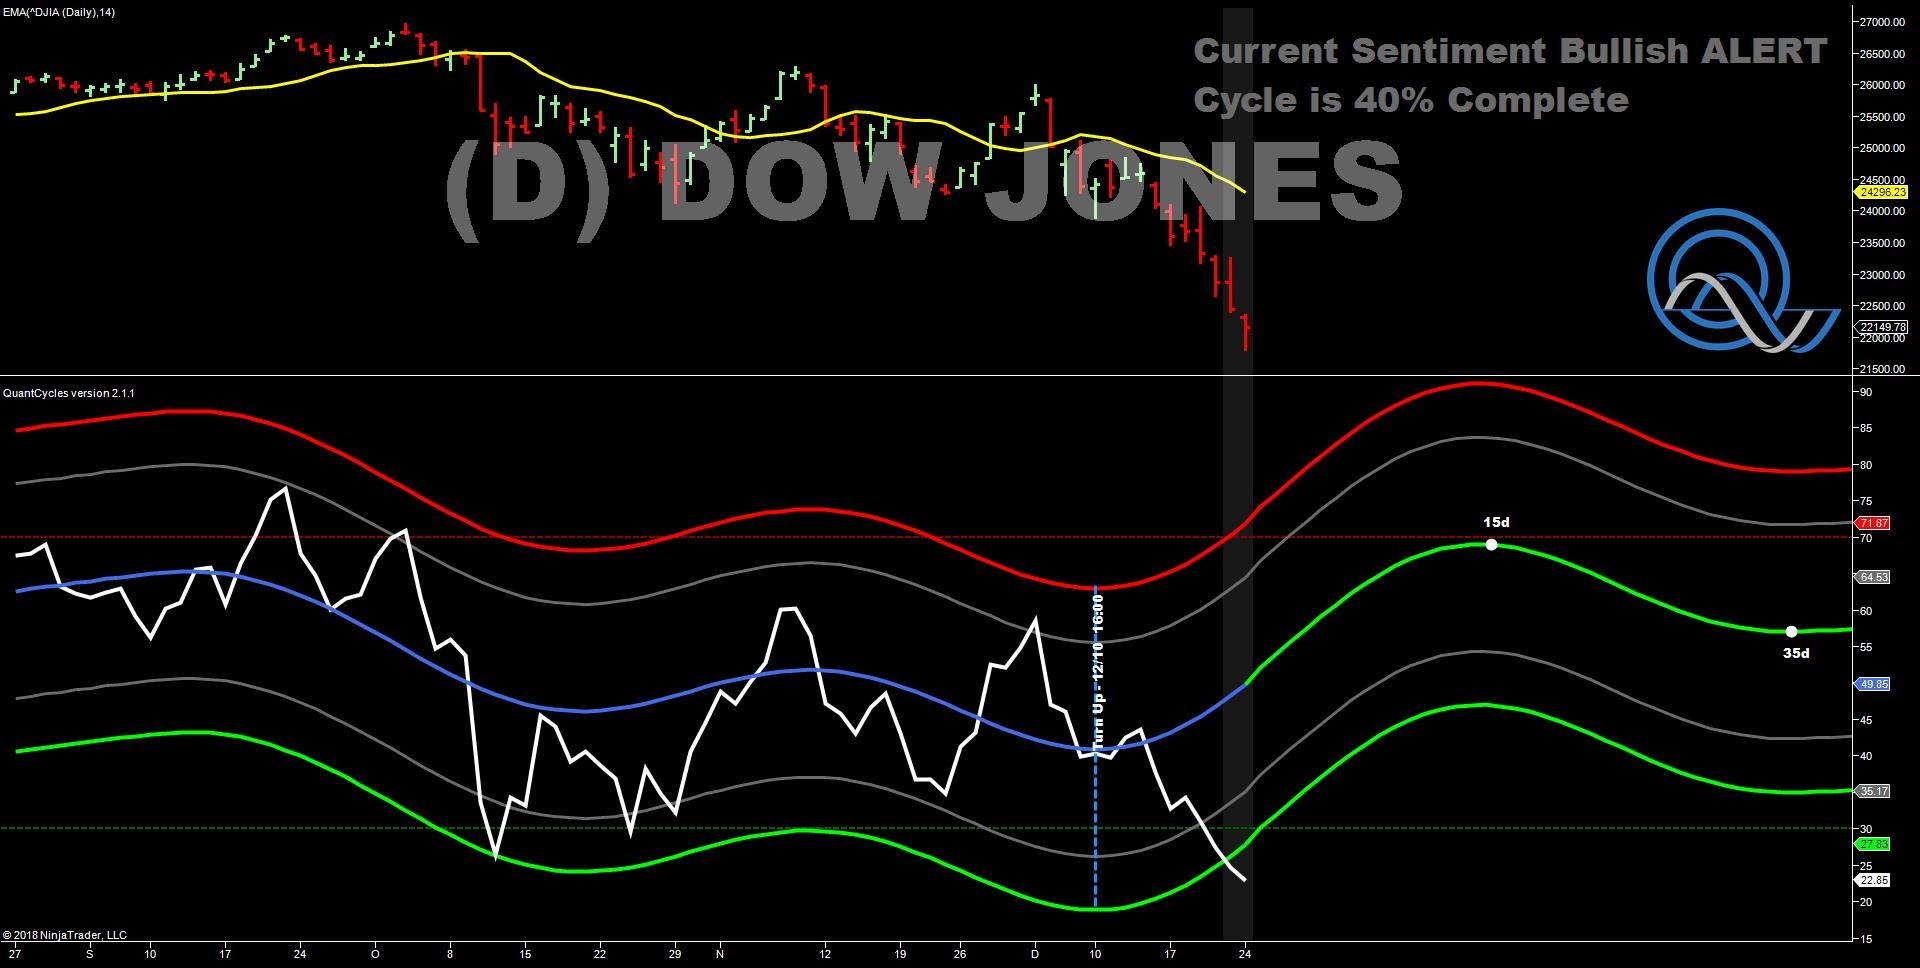
The above chart is an extremely bullish set up. The trader has two things in his or her favor: The market is extremely oversold and the indicator is predicting the Dow will move higher over the next four to six weeks. See what happened.
What now?
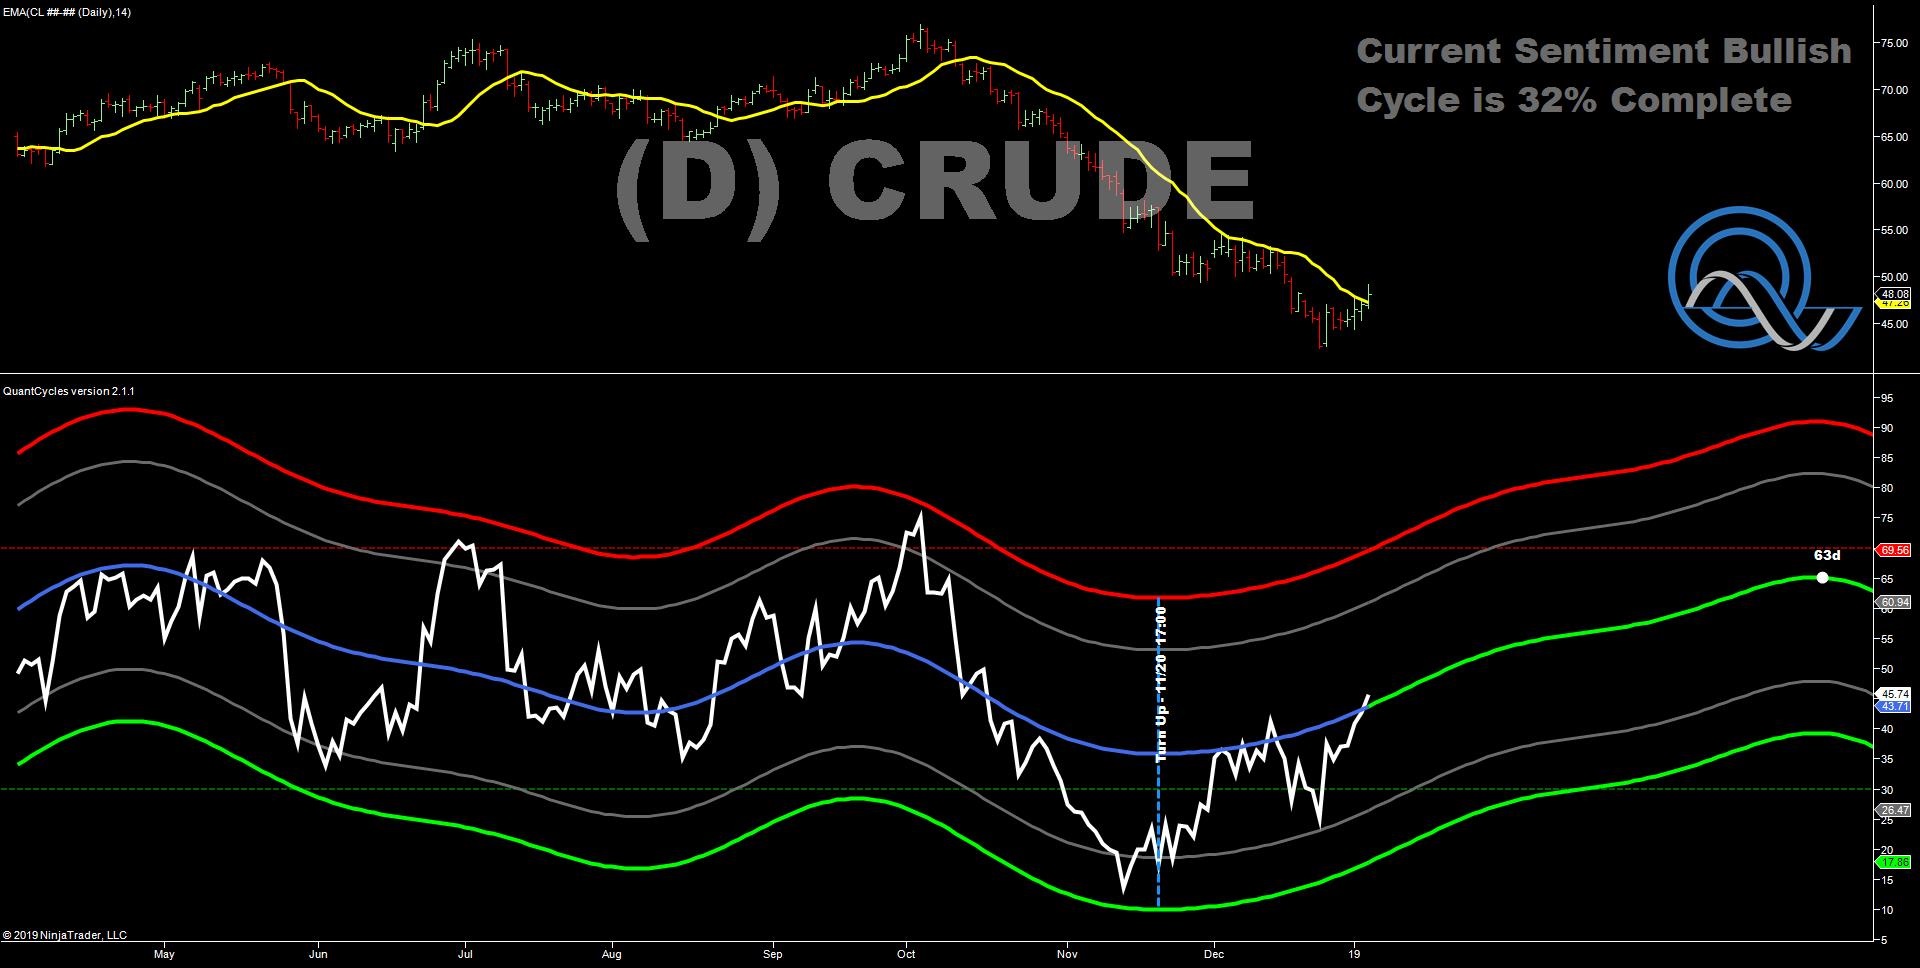
Take a look at the Jan. 7 daily QuantCycle in crude oil (below). You can see that it was a little bit early in predicting the bottom of the crude oil sell-off, but forecasts crude to continue on its upward correction for the next two months. This is telling you to 1) get out of shorts, 2) stay long if you are long, and 3) it is not too late in the move to get long.
Long Bond
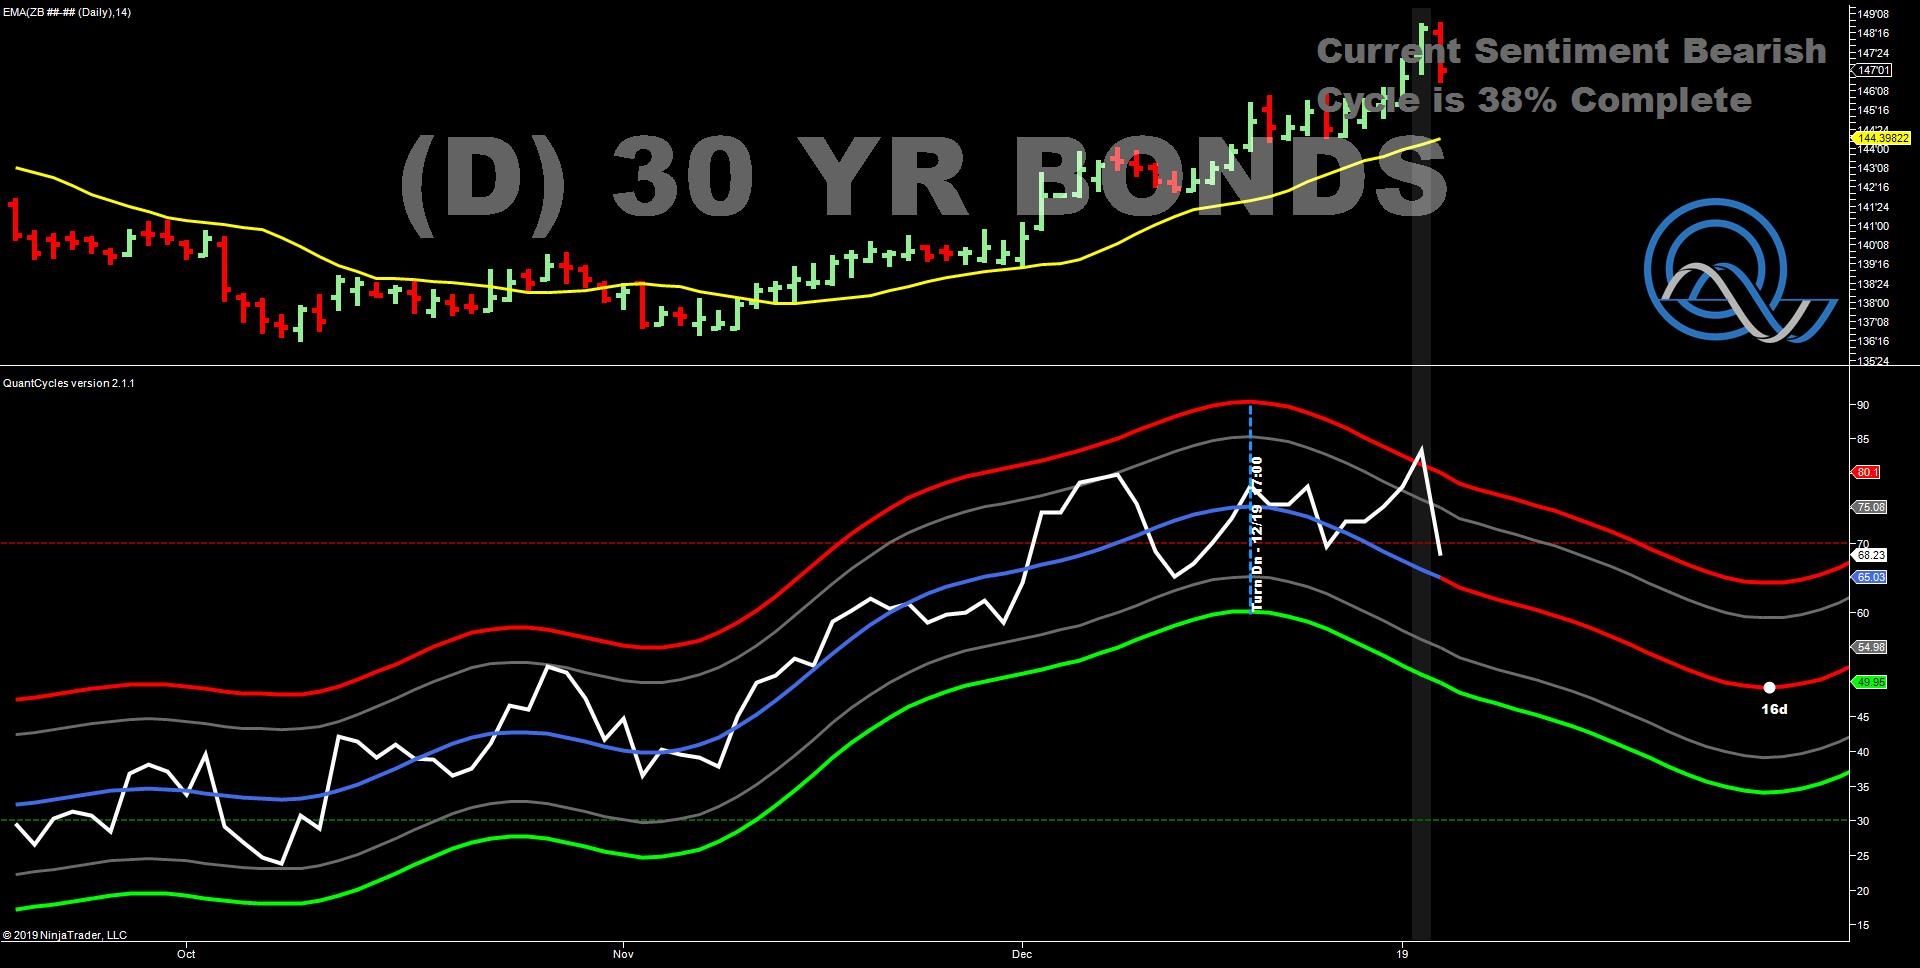
The Jan. 7 QuantCycle chart on the 30-year Treasury bond shows the long bond hitting overbought territory in the first week of January after an indication that the cycle reversed lower in the second half of December. Couple that would the reversal on Jan. 3 and there is clear sell signal for the long bond. The QuantCycle is forecasting that the 30-year will continue to head lower for the next two weeks.
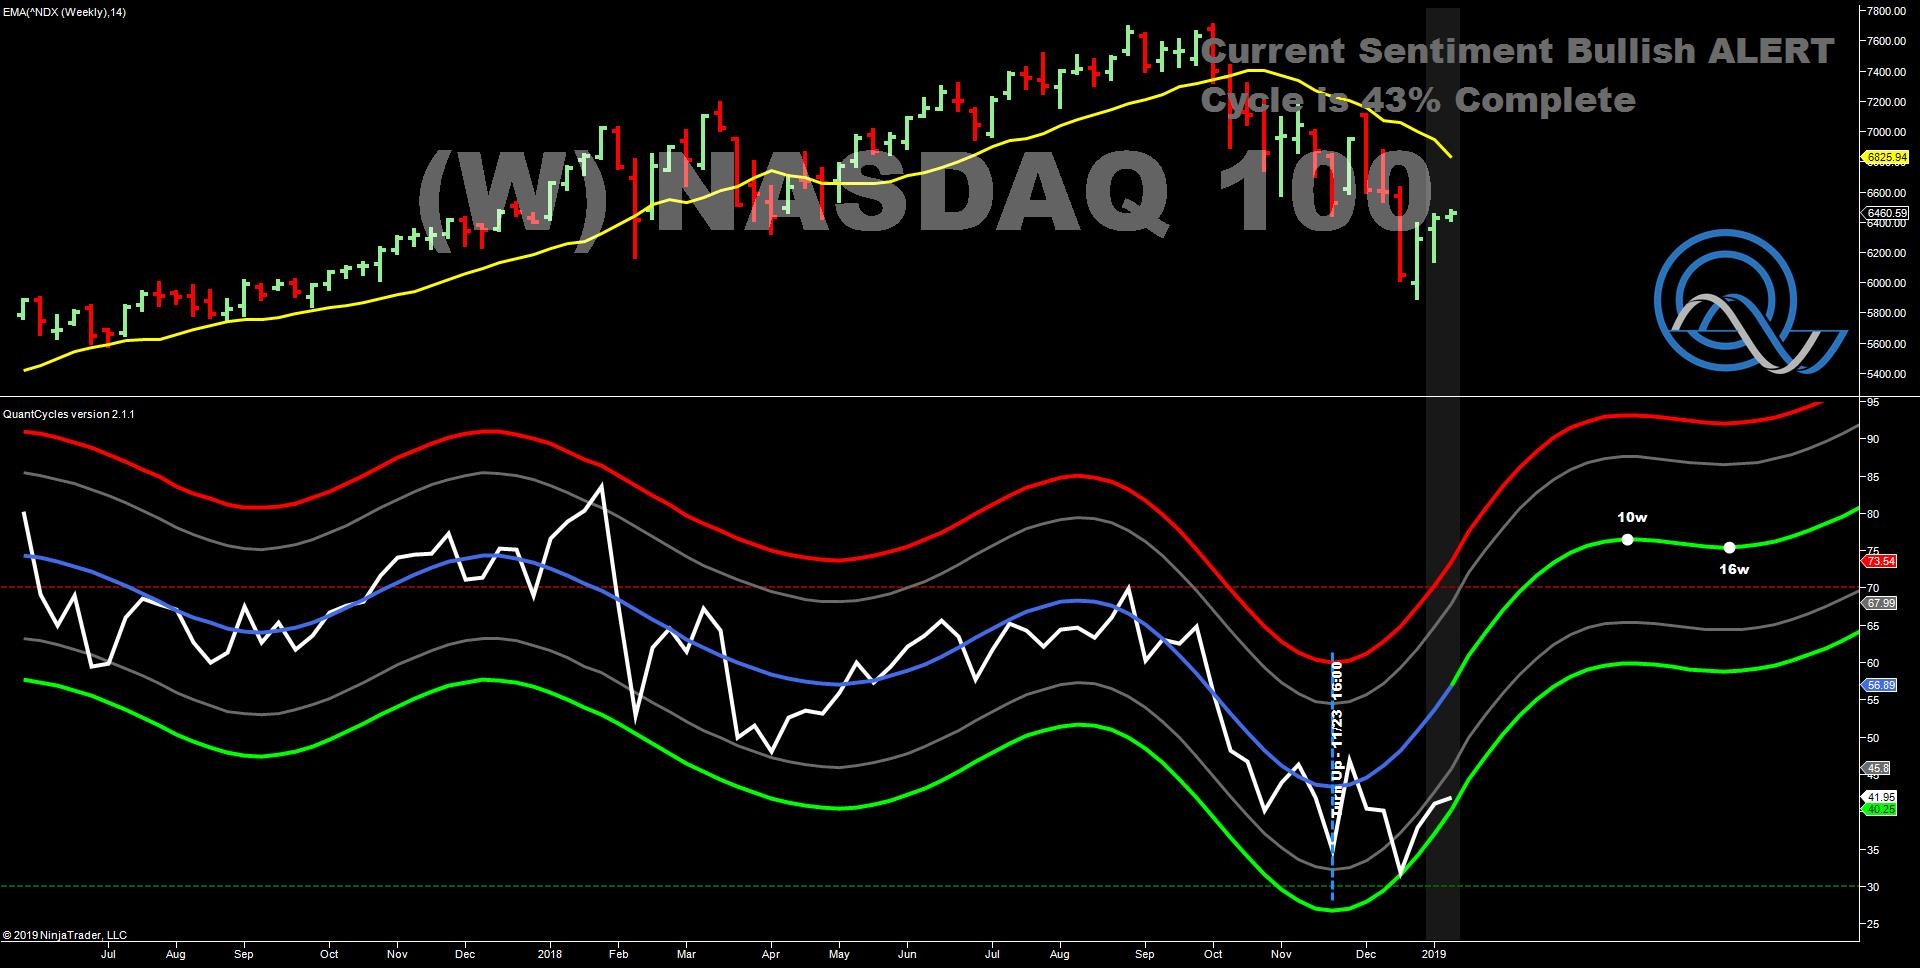
Nasdaq 100
Perhaps the sharpest signal by the QuantCycle is in the Nasdaq 100 on a weekly basis. While the QuantCycle was early in predicting a market bottom in the Nasdaq, that allowed the market to touch oversold territory just as it is calling for a sharp upward revision. This is a very bullish indicator, but because it is on a weekly timeframe the timing may not be as precise. Also, it would be wise to hold off putting a position on until after tonight’s presidential address that could disrupt equity markets.