
The S&P 500 is likely to drop 10% before heading to new highs in 2019 based on consistent pattern that repeated in 1990, 1998 and 2011 reports Joon Choi.
The S&P 500 Index had its best January since 1987, gaining 7.9%. Equities have been on a tear since the Dec. 24th low, with the S&P gaining 16%. Investors’ sentiment rose from extremely bearish to bullish primarily due to solid corporate earnings and the Fed’s course correction. However, the S&P 500 Index has a major hurdle to clear before it pushes significantly higher, resistance at the 200-day moving average.
200-day moving average
Moving averages are widely used in the financial markets to smooth data to suppress noise. For example, economists use them to smooth volatile economic data to determine trends. Similarly, investors sometimes use moving averages to gauge whether an investment vehicle is on an uptrend or downtrend.
The 200-day moving average is an important pivot area following a major move. It often determines the difference between a correction and a major shift in trend, especially when a market is straddling a 20% move—the official designation of a shift in sentiment.
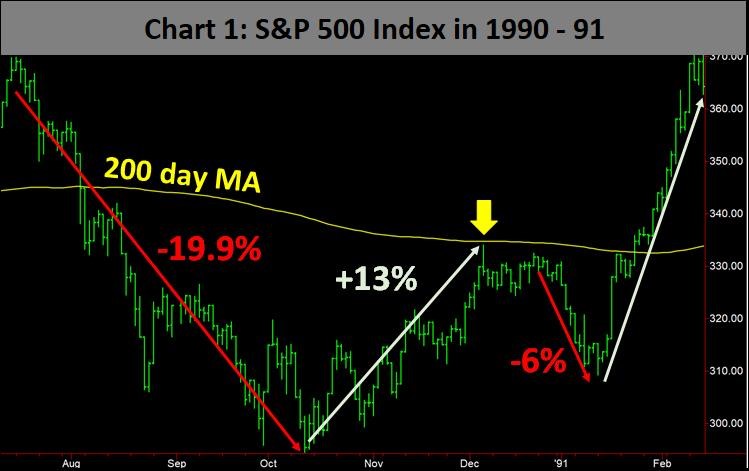
During a mild recession in 1990, the S&P 500 Index (SPX) sold off 19.9% from July 16 to Oct. 11 (see Chart). Equities rallied 13% in the next two months; only 0.2% from touching the 200-day MA. SPX traded sideways in the next couple weeks and then it sold off 6%, which was then followed by a sharp rally in route to a new high.
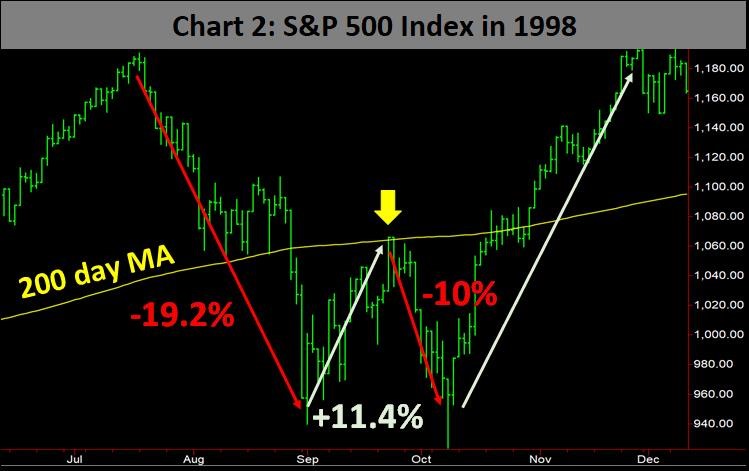
In the summer of 1998, an Asian currency crisis led to a 19.2% selloff from July 20 to Aug. 31 (see Chart). SPX sharply rallied 11.4% in less than a month but stalled at the 200-day MA and the Index sold off 10% in route to a new intraday low in October. Then SPX reached a new high by year end.
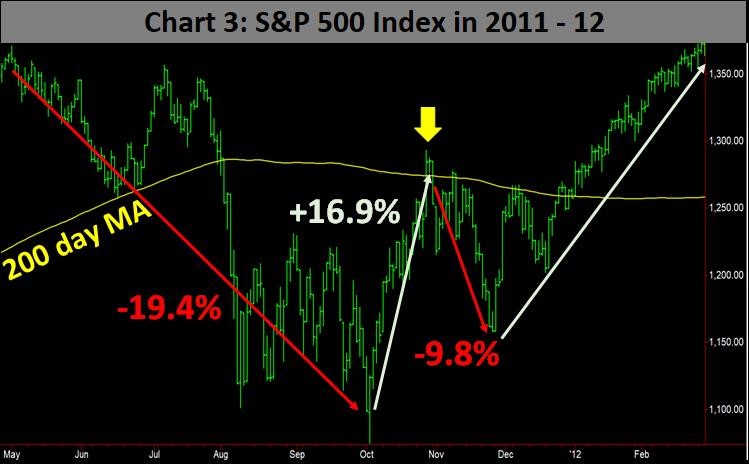
In the summer of 2011, SPX sold off 19.4% to fears of contagion of the European sovereign debt crisis (see chart). The index rose 16.9% in less than a month, but the rally stalled slightly above the 200-day MA, followed by a 9.8% selloff. Like the prior two examples, SPX eventually reached a new high in the coming months.
The average drawdown of the three corrections above is 19.5% followed by an average rally of 13.8% to the 200-day MA and an 8.6% selloff before SPX reached new highs within two months.
Current Status
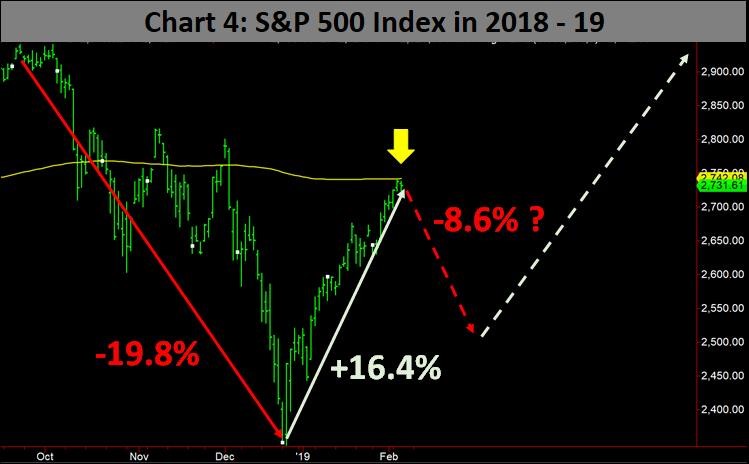
SPX fell 19.8% from its all-time high from Sept. 20 to Dec. 24th (see chart). This selloff also came awfully close to the classic bear market level of a 20% selloff, similar to the three cases above. The index came within three points of touching the 200-day MA in the last couple days. Based on previous observations, we may be due for an 8.6% equity selloff (an average of three prior selloffs after reaching the 200-day MA) in the coming weeks.
Conclusion
The 200-day MA may provide some insights on stock market behavior after the S&P 500 Index suffers a near bear market correction, as it did in 1990, 1998 and 2011. The current SPX pattern closely resembles the index’s behavior during the three instances above. As a result, we are due for some weakness in stocks (possibly near 10%). However, the selloffs were followed by sharp rallies which led to new highs in slightly less than two months (57 calendar days). We may see a strong market in 2019 if history serves as a guide. But patience is called for because the pattern calls for a close to 10% correction—putting the S&P around the 2,520 level — before we see another sustainable rally.


