
This week’s QuantCycle report includes a strong spread opportunity, notes John Rawlins.
This week’s best QuantCycle plays and a recap from last week.
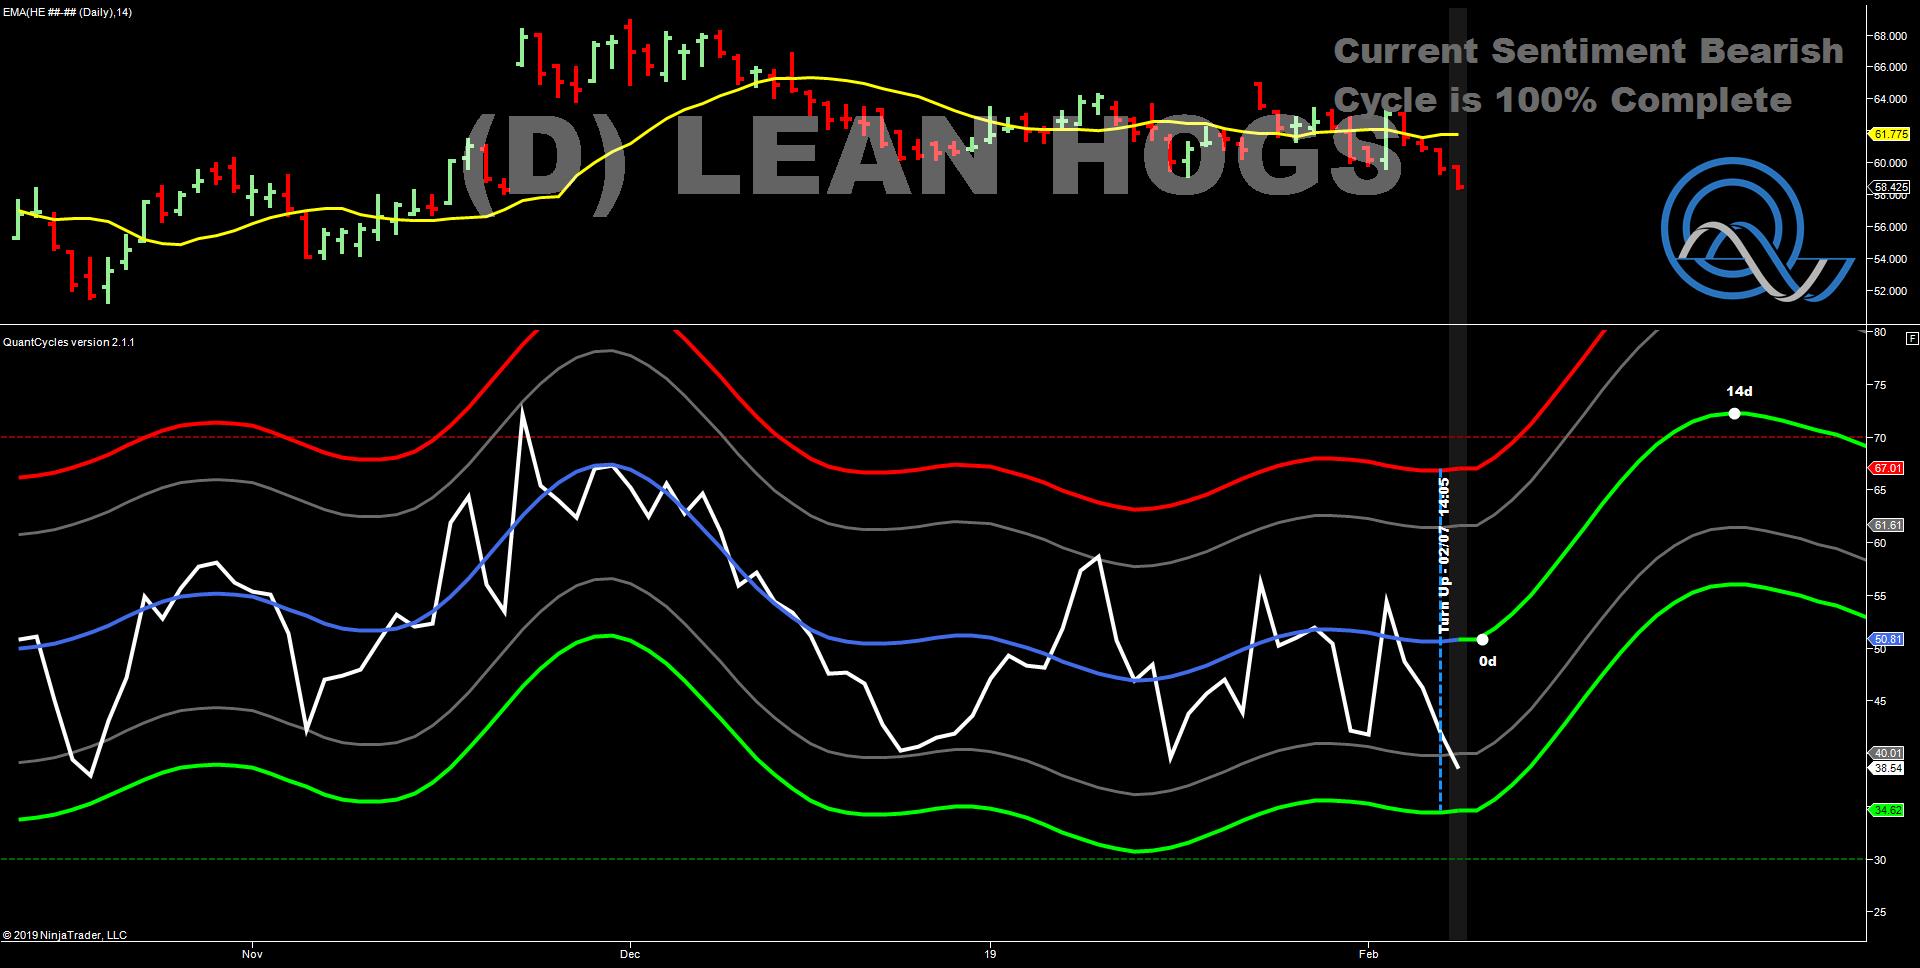
Lean Hogs
Lean hogs sold off the last four days of last week as the QuantCycle Indicted a quiet range bound market. The daily QuantCycle, however, has the hogs turning sharply higher over the next two weeks. The provides a tremendous buying opportunity in hogs as last week’s sell-off has put it into oversold territory just as the QuantCycle is turning higher.
Live Cattle
Live cattle futures have been in a long-term rally since last May. The long-term (weekly) QuantCycle on live cattle future predicted this bull move would top out in the New Year. However, cattle continued to rally and is now near extreme overbought territory. This is a great potential short as the QuantCycle is expecting a sharp decline (along with seasonal tendencies) in beef over the next six weeks.
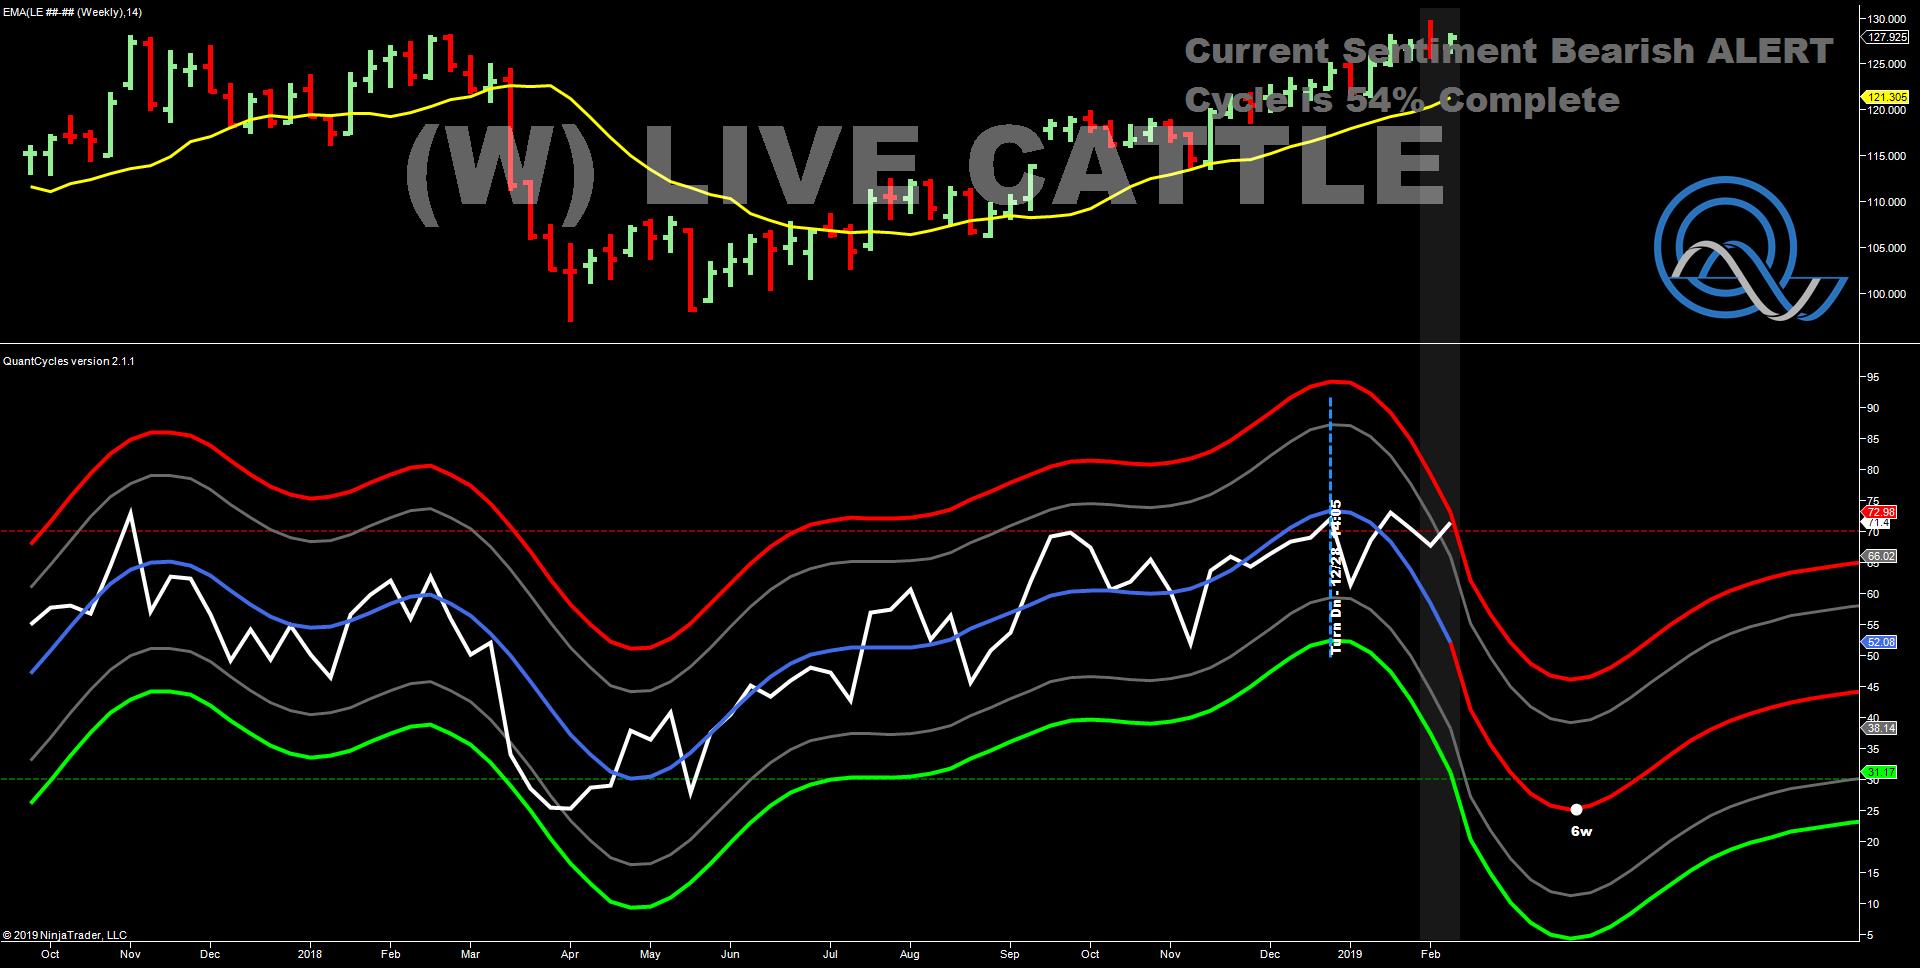
If you want to play it say—or perhaps put on a size spread— you could buy lean hogs and sell live cattle. Give that the QuantCycle is indicating a bullish move in hogs along with a bearish move in cattle, you can enter this as a spread and lever more contracts. Since hogs and cattle are generally correlated you will get more bang for your buck. You do not need to be right on both sides, you only need the oversold hogs to outperform the overbought cattle. This is a unique opportunity.
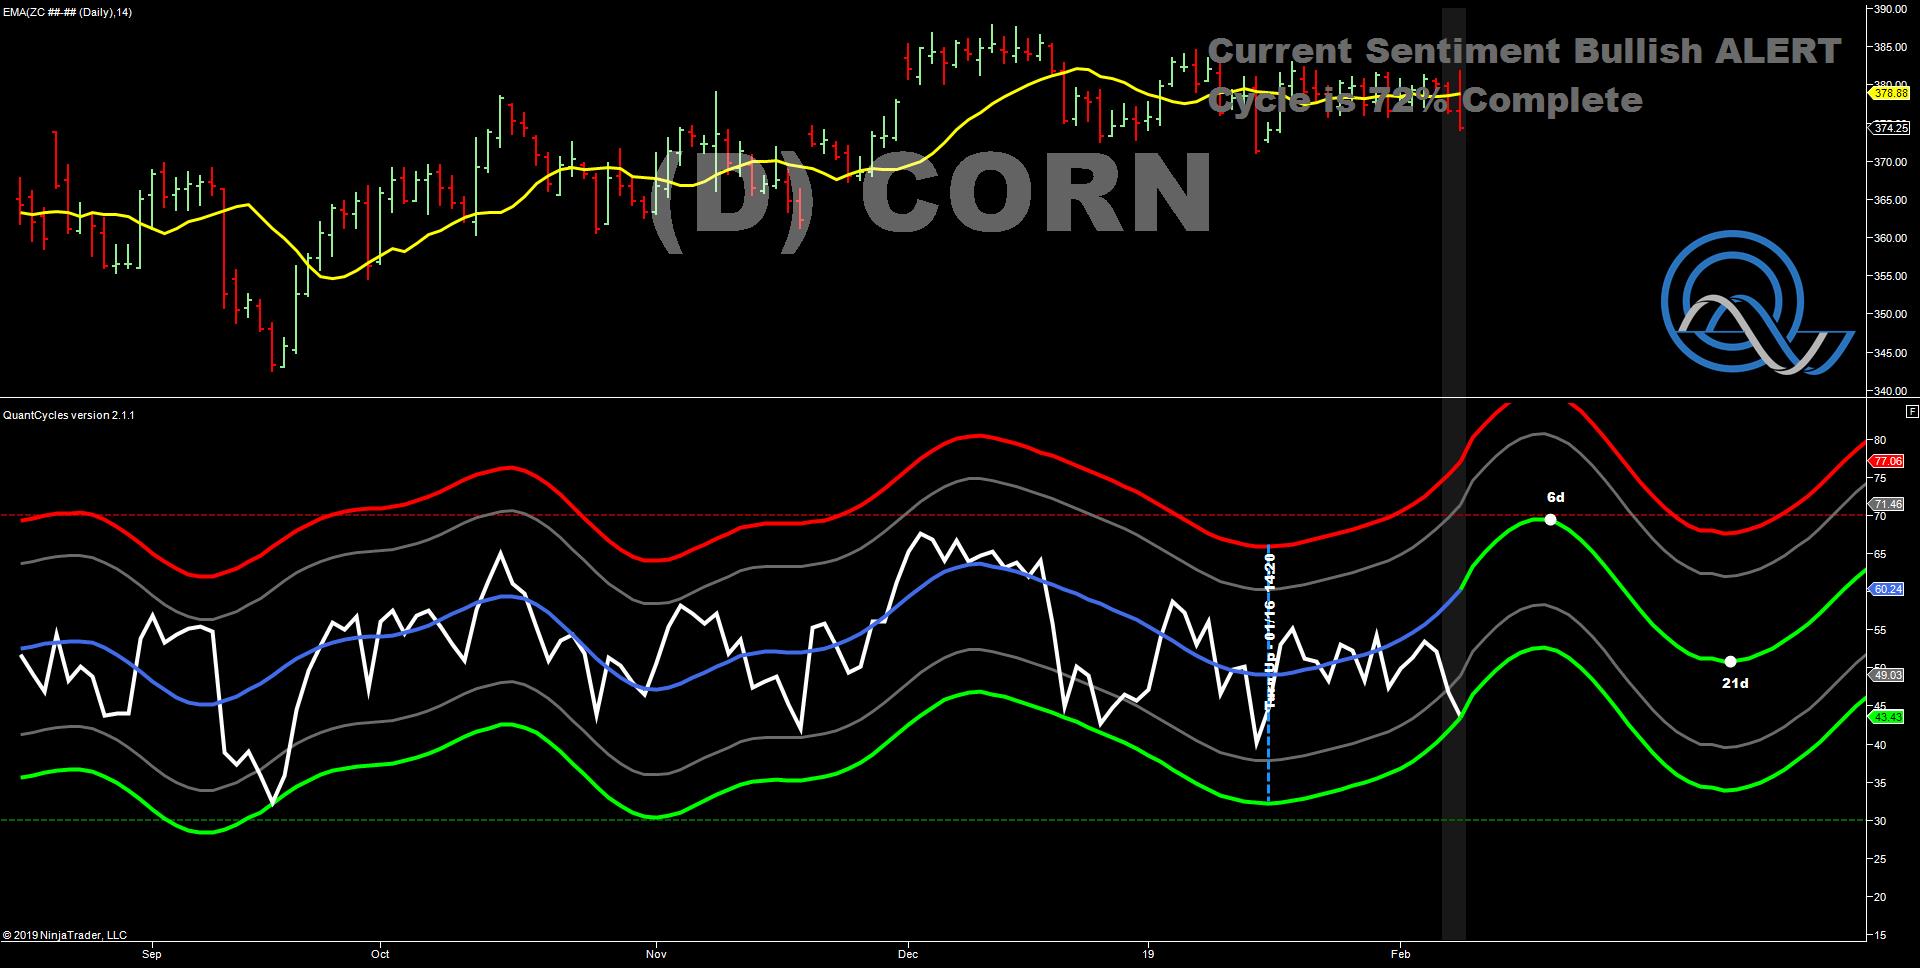
Corn
March corn futures have been floating in a narrow range from roughly $3.70 to $3.90 since Thanksgiving 2018. The QuantCycle Oscillator had corn in a long slow up move that is set to accelerate in February. Corn has meandered lower in 2019 up to the point where the QuantCycle expects corn to begin to move sharply higher.
This has set up a strong bullish opportunity as corn has moved close to extreme oversold territory just as the QuantCycle indicates a sharp move higher. This is a short-term play as the QuantCycle has corn reversing back higher after six days. If correct, traders should be ready to take profits at the end of the week and contemplate reversing from long to short.
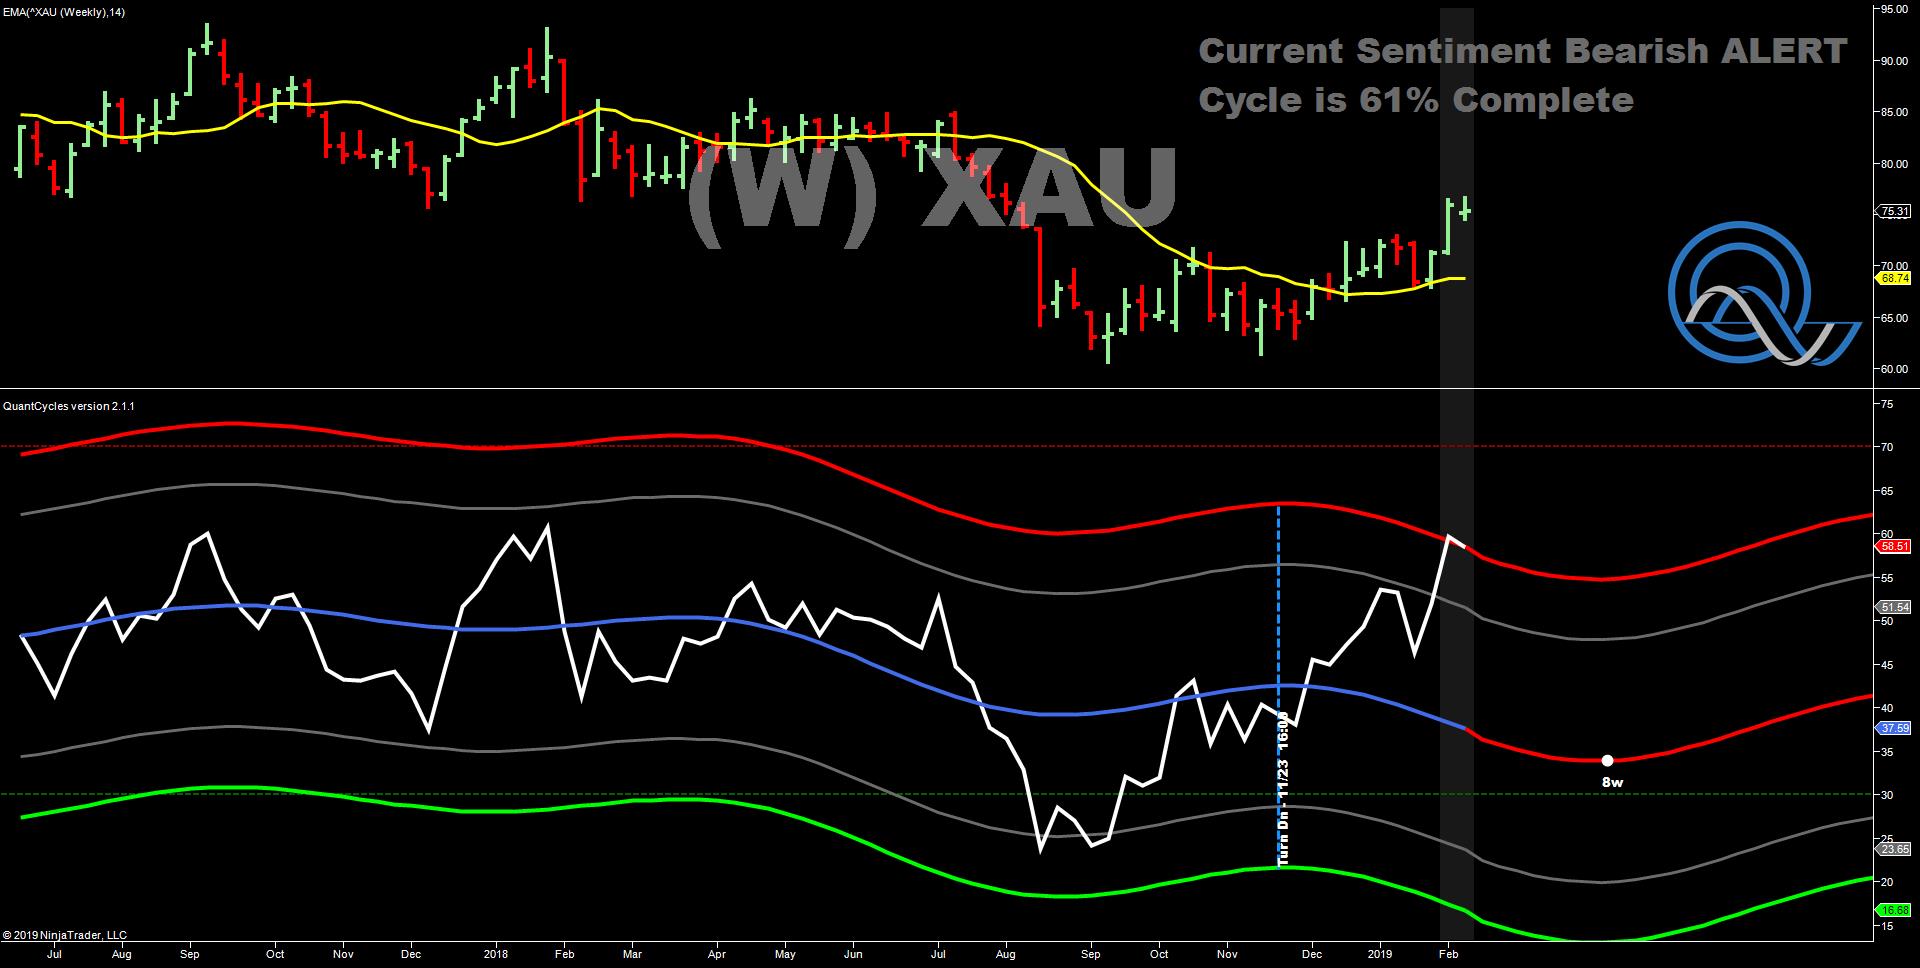
Gold & Silver Update
Last week the QuantCycle indicated weakness in the Philadelphia Gold and Silver Index (XAU), which includes 30 precious metal mining companies. The XAU marginally dropped throughout last week. While it did drop last week, the weekly QuantCycle (see chart) still shows XAU as overbought and expects it to weaker over the next eight weeks.
The QuantCycle indicator is a technical tool that employs proprietary statistical techniques and complex algorithms to filter multiple cycles from historical data, combines them to obtain cyclical information from price data and then gives a graphical representation of their predictive behavior (center line forecast). Other proprietary frequency techniques are then employed to obtain the cycles embedded in the prices. The upper and lower bands of the oscillator represent a two-standard deviation move from the predictive price band and are indicative of extreme overbought/oversold conditions.


