
John Rawlins share some long-term plays in the commodity sector.
We have provided numerous short-term trading signals based on the QuantCycles Oscillator cyclical analysis over recent weeks. This week we will take a step back and show some longer term plays, starting with the commodity sector.
Copper
Copper is often referred to as the commodity with a PhD because it is used as a raw material in so many things—automobiles and housing in particular— that growth in copper demand is viewed as a significant economic indicator. Copper has rebounded with the broader market since the beginning of 2019, but now appears overbought on the weekly QuantCycle chart, which expects copper to turn lower for the next 11 weeks.
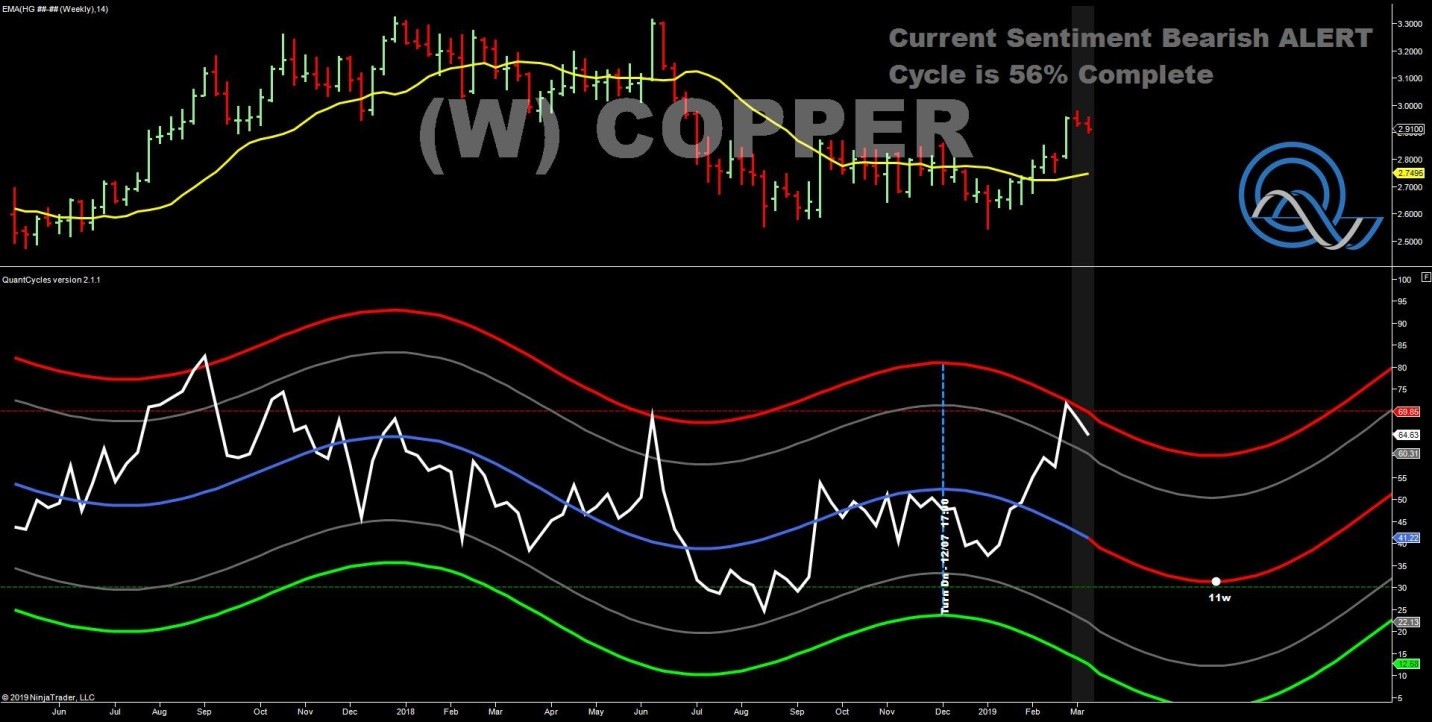
This appears to be a strong shorting opportunity.
Coffee
The QuantCycle Oscillator predicted coffee would turn higher in the middle of January, which it did briefly, but has more recently sold off pushing close to oversold territory while the QuantCycle expects coffee to move higher for the next seven weeks.
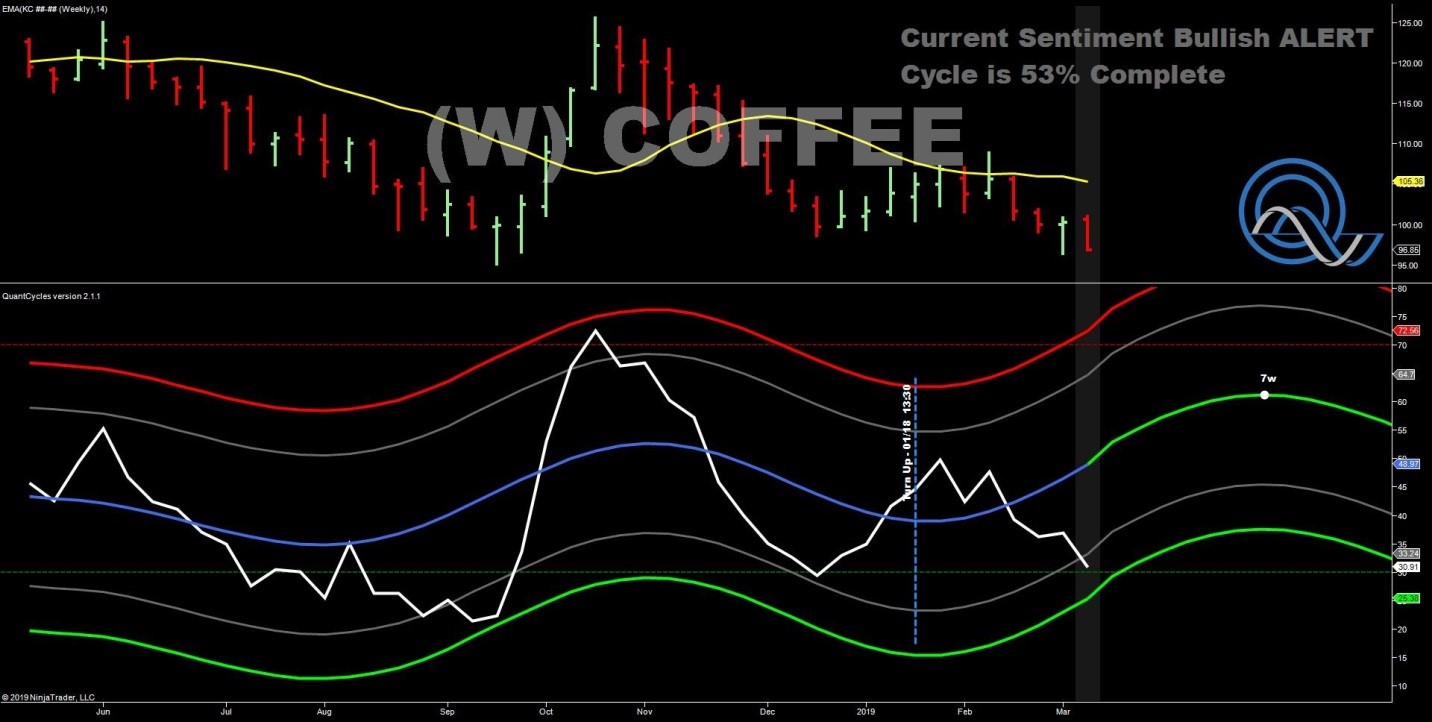
Coffee also appears to have touched on a double bottom support level. Strong buy opportunity.
Live Cattle
Live cattle has climbed a wall of technical/cyclical worry for several weeks now, skating along overbought territory. It seem to have hit serious resistance at the $1.30 level and is expected to decline sharply over the next four weeks before rebounding and continuing to decline later in the summer.
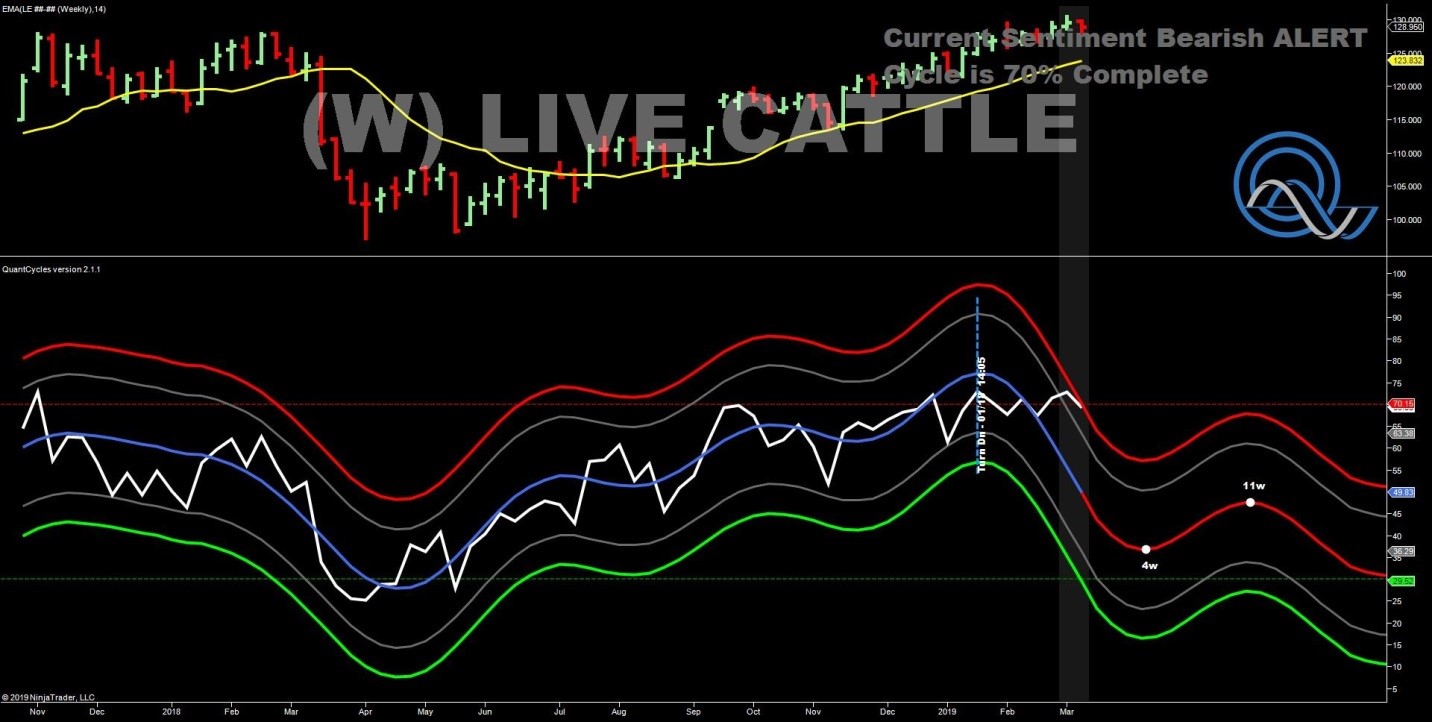
A decline is likely before a rebound heading into summer grilling season.
Wheat
After floating in a relatively flat range since later summer 2018, wheat has turned sharply lower. This has blown away our oversold level on our long-term oscillator just as it has turned higher.
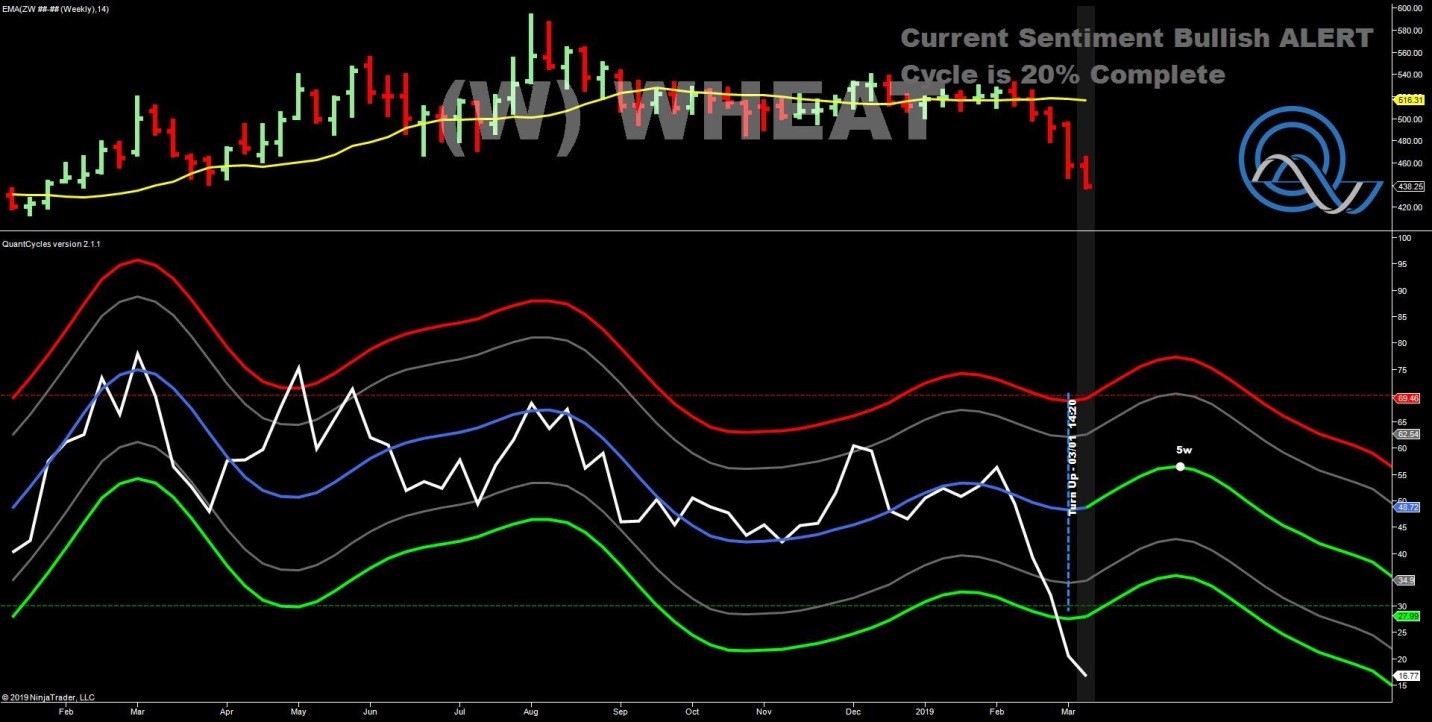
While the QuantCycle does not expect a dramatic upturn in wheat, it is so oversold that this is an extremely strong play, especially when you look at the daily QuantCycle.
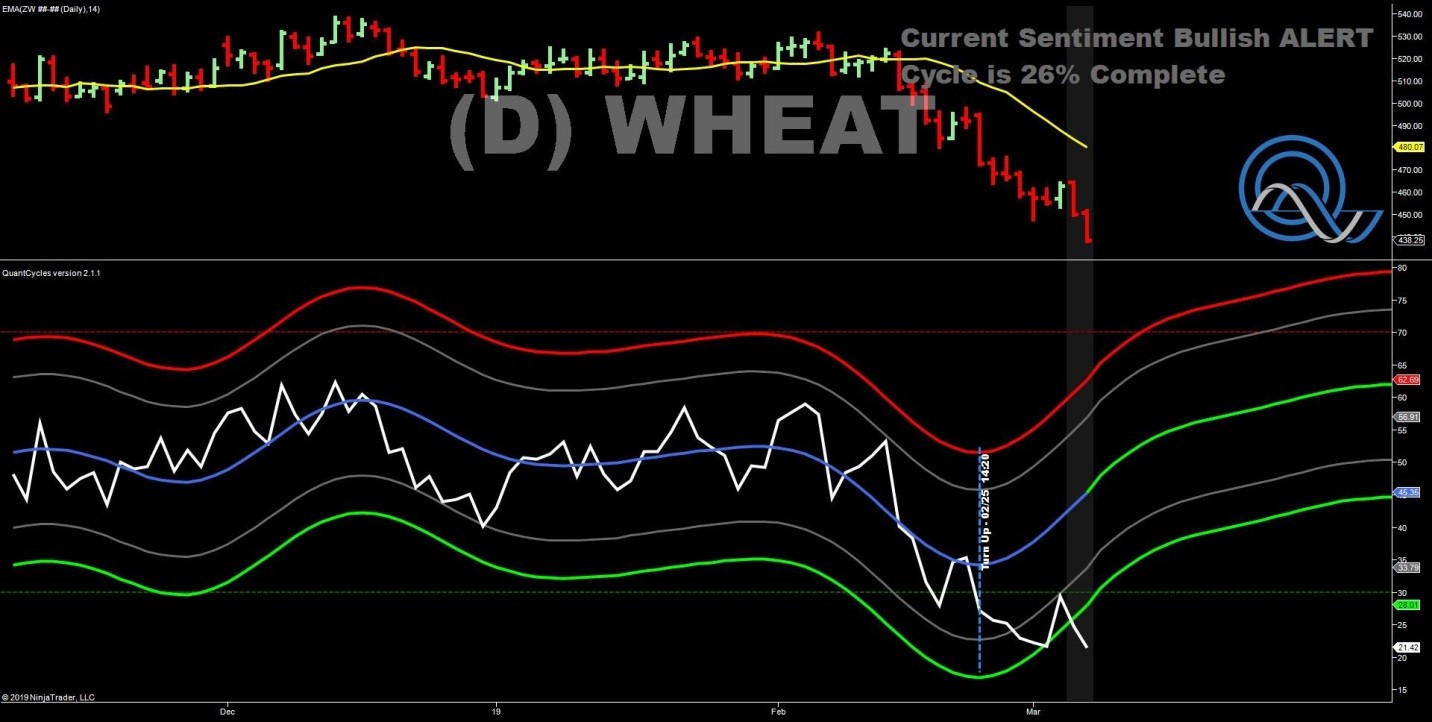
This type of confirmation adds confidence to a long wheat position.
John Rawlins described the value of the QuantCycle Oscillator recently at the Orlando MoneyShow.
The QuantCycle indicator is a technical tool that employs proprietary statistical techniques and complex algorithms to filter multiple cycles from historical data, combines them to obtain cyclical information from price data and then gives a graphical representation of their predictive behavior (center line forecast). Other proprietary frequency techniques are then employed to obtain the cycles embedded in the prices. The upper and lower bands of the oscillator represent a two-standard deviation move from the predictive price band and are indicative of extreme overbought/oversold conditions.


