
The E-mini S&P 500 has been rallying for three months, but there are red flags showing, writes Al Brooks.
The E-mini S&P 500 has been rallying strongly for three months, but there are several bearish short- and long-term chart patterns that are signaling a warning sigh. If the bulls do not resume their rally this week, the odds will begin to favor a one- to two-month selloff.
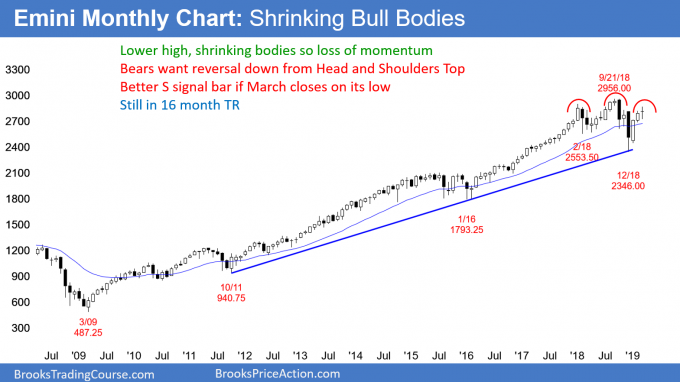
The monthly S&P500 E-mini futures chart has a doji bar so far in March. If the month closes on its low, it will be a sell signal bar for next month. There are still six trading days left in March, and the bar might look different once it closes (see chart below).
The bulls are hoping that the December selloff was just a sharp test of the bull trend line in the 10-year bull trend. Since the S&P had never been as overbought as it was in January 2018, there was an increased chance of a deeper selloff that lasted more than a few bars. And that is what the bears got last year.
My post from early 2019 describes the criteria I used to explain why the bull trend had the most extreme buy climax in history. I also explained why a 5% to 10% correction was likely to begin within weeks. After rallying one more week after that post, the E-mini dropped 12% over the following three weeks.
Is the 10-year bull trend resuming up to 3,600?
The question at the moment is, “Will this rally continue to a new all-time high without a pullback?” The bulls are hoping that the February 2018 and the December 2018 lows were just two legs down in a strong bull trend. They see those lows as a double bottom bull flag. If they are right, they expect a new all-time high within a couple of months.
Furthermore, they want the rally to continue up for a measured move. The neck line of the double bottom is the September high of 2956.00. Since the December low is about 600 points lower, they want a measured move up to above 3,600 over the next couple years.
No one is talking about this yet, but that is the bull case. If there is a strong break above 3,000, the TV pundits will begin to mention 3,600. At the moment, this is unlikely in the next couple years.
Trading ranges resist breaking out
Why do I believe this will not happen? First, the monthly chart has been in a trading range for over a year. Most strong legs up and down within a trading range reverse. Consequently, even if the bulls get a break above the September high, it would more likely reverse than continue up to the measured move target.
If there is a new high and then a reversal, the monthly chart would have an expanding triangle top. That is a type of higher high major trend reversal.
If there is a reversal over the next few months from a lower high, there would be a lower high major trend reversal. Any major trend reversal with a decent sell signal bar has a 40% chance of a swing down.
At the moment, if there is a strong reversal down this year, there is a 30% chance of a break far below the December low. The next support is below 2,000 at the bottom of the 2015 – 2016 trading range.
Will March close on its high?
So, what is most likely? My 80% Inertia Rule says that markets tend to continue to do what they’ve been doing. Since the E-mini has been in a trading range, the odds are that it will continue for many more bars. This is true even if there is a break to a new high.
I mentioned that this month’s bar might look different once March ends. If there is a selloff in the final few days, March would be a strong sell signal bar. That would increase the chance of a selloff. Because the monthly chart has been in a trading range for 16 months, every leg up and down will likely reverse every two to three months, as has been the case.
Weekly S&P 500 E-mini futures chart
The weekly S&P 500 E-mini futures chart rallied and reversed down last week after the previous week’s strong reversal up (see chart below). I wrote throughout February that the pullback would only be two to three weeks after a 10-bar bull micro channel. However, I also made the point that the bull trend resumption also typically only lasts a few weeks. At that point, the market often has a more protracted pullback.
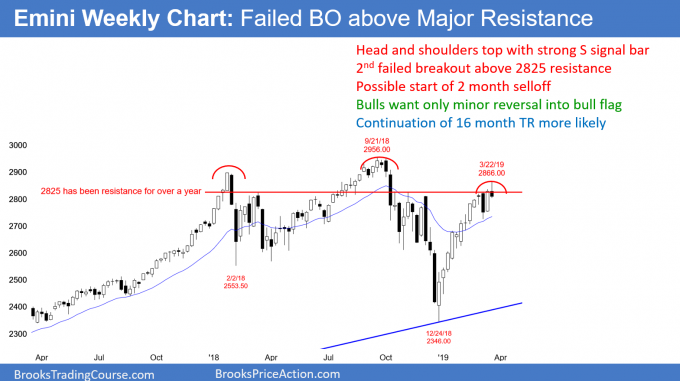
Ten weeks without a pullback is a buy climax. The bulls were strong enough to get at least one more leg up. This past week met that minimum goal. But the bulls were exhausted from the buy climax and took profits. If the profit taking continues this week, the bulls might wait for many bars before buying again.
Last week closed on its low. It is a good sell signal bar for this week. It is also the second sell signal at resistance in four weeks. This increases the odds of at least a minor reversal. However, the buy climax was so extreme that the reversal will probably be deeper and last longer than what the TV pundits will say.
A reasonable target is two legs down to 2600 over a couple months. The bulls will then look to buy to create a higher low and a rally into the end of the year.
High Probability a sell-off is coming
It is important to understand that no year goes straight up. Traders should expect at least a couple months of sideways to down trading. That is what has happened in 80% of past years.
Because the three-month rally has been extreme, the odds of the pullback beginning within a month are higher. Therefore, traders always have to consider the opposite of what they think is obvious.
Yes, the rally has been strong for months. And, it has been especially strong for a couple of weeks. Everyone on TV is only talking about a continuation up. I have been writing about a one- to two-month selloff from above the October high. If the next couple weeks are bull bars closing near their highs, I will change my stance and conclude that the E-mini will probably make a new high in April.
More likely, this two-week rally is an exhaustive end of the three-month rally. If the bears get one or two big bear bars closing on their lows within the next few weeks, a bigger pullback will probably be underway. It could also begin with three or four unremarkable bear bars.
What will a top on the weekly chart look like?
If the three-month rally has been a buy climax and ends with a reversal down, the bears will want to see a sell signal bar that is a big bear bar closing near its low. They got that this week. In addition, they will want the entry bar to also be a big bear bar closing on its low. They hope to get that next week.
Finally, they will want most of the upcoming bars to be bear bars, and they prefer to see them closing below their midpoints. Over the next month, we will find out if they succeed.
The bears see the rally as the right shoulder of a head and shoulders top. The January 2018 rally is the left shoulder. Every head and shoulders top is a lower high major trend reversal. Every major reversal setup has a 40% chance of a swing down. The minimum goal is two legs and about 10 bars.
The neck line of the head and shoulders top is the December low. There is currently only a 30% chance of a strong break below that low.
Likely continuation of the trading range
The E-mini has been in a trading range for 16 months. That will likely continue indefinitely. If there is a new high, the E-mini will probably reverse down. If there is a selloff, it will probably reverse up from a higher low.
As I wrote above, major reversals actually lead to a new trend only 40% of the time. Consequently, they more often lead to a continuation of the trading range or a resumption of the bull trend. Therefore, even if the bears get a selloff, the E-mini will probably stay within the 16-month range. The bears need two closes below the December low before traders believe that a bear trend is underway.
Similarly, the bulls need two closes above the September high before they will conclude that a measured move up has begun. A continuation of the trading range is what is most likely.
Bulls will buy even a deep selloff
If the bulls take profits and the bears get a selloff into the summer, the bulls will look to buy again after two to three legs down. Even though the three-month rally is climactic, it represents strong bulls. Therefore, the bulls will look to buy the selloff.
This is true even if a selloff retraces more than half of the rally and the E-mini drops below 2600. Their buying would create a higher low. That higher low would be the right shoulder of a head and shoulders bull flag. The November low would be the left shoulder. A rally from there in the second half of the year would have a good chance of leading to a new all-time high.
Daily S&P 500 E-mini
The daily S&P 500 E-mini futures chart has rallied strongly for three months (see chart below). The bulls this week twice got a breakout above the October-November-December triple top. They hope that Friday’s selloff will be brief and that the rally will continue up to a new all-time high. If there are more bull bars closing near their highs next week, the bulls will likely achieve their goal. After Friday, this is now unlikely.
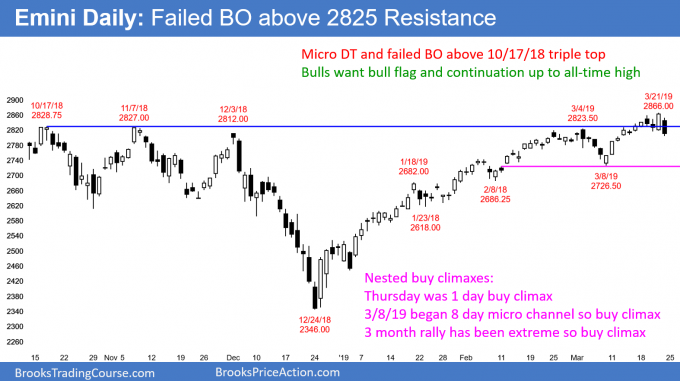
This rally has been unusually strong. It is therefore a buy climax. It is important to note that the E-mini broke strongly above 2825 in January and July last year. It reversed down strongly both times.
Will this time be different? We will find out over the next couple weeks. Friday’s big bear trend bar closing on its low means that the rally reversed down from above 2825 for a second time last week. Last Tuesday was the first time. A second reversal has a higher probability of leading to a swing down. This is especially true if the bears get a big bear bar on Monday.
Parabolic wedge buy climax
Thursday’s buy climax was at the end of an eight-day bull micro channel, which is a buy climax. It was therefore nested within a bigger buy climax. Both are within a three-month buy climax. Three nested buy climaxes in a tight bull channel is a type of parabolic wedge buy climax.
Remember, the E-mini is still in a 16-month trading range, and most breakouts within trading ranges fail. What is taking place is consistent with a failed breakout above the 2018 triple top.
Thursday was an unusually big bull trend day. Friday’s big selloff means that Thursday formed a micro double top with Tuesday’s high. This is the minimum that the bears needed to begin a trend reversal down. With Friday closing on its low, it is a good sell signal bar for Monday.
This week is unusually important. If the bulls get a couple closes above last week’s high, the odds will favor a new all-time high without more than a minor pullback. The bear case is now stronger.
If next week has several consecutive bear days, the odds will favor a one- to two-month pullback from a parabolic wedge buy climax. This week could go sideways and put off the decision for another week or two. What is now taking place affects what the next two months look like. The bears finally have a chance to take control.
What would a top on the daily chart look like?
When a bull trend is strong, the bears usually have to stop the buying before they can begin the selling. This means that a bull trend typically transitions into a trading range for at least five to 10 bars before the bears can take control. At a minimum, the bears need a micro double top. They got that last week.
With the second reversal down from above 2825 and the strong sell signal bar on Friday, the bulls might begin to aggressively take profits. This is because their profits are extreme, and they do not want to risk giving them back.
Every bear trend begins with the bulls taking profits. If there are one or more very big bear days in the next couple of weeks, it would indicate that the bulls are panicking out of their longs. That will encourage the bears to sell, hoping that the profit taking could last for a couple of months.
But, even if it does, the top of an unusually strong rally like this usually gets tested. Therefore, the selloff will probably form a higher low and the E-mini would come back to this area within a few months.
The bulls have a good chance of a new all-time high at some point this year. However, unless the bulls break strongly above this week’s high with the next few weeks, the new high might not come until the fall.
Trading Room
Traders can see the end of the day bar-by-bar price action report by signing up for free at BrooksPriceAction.com. I talk about the detailed Emini price action real-time throughout the day in the BrooksPriceAction.com trading room. We offer a two-day free trial.


