
Several opportunities in the grain complex has arisen after Friday’s sell-off, notes John Rawlins.
Volatility ramped up in the gain complex on Friday as we get closer to the critical planting season for the bulk of the U.S. grain production region.
It is a good time to take a look at what the QuantCycles short- , intermediate- and long-term outlook looks like in all the grain markets.
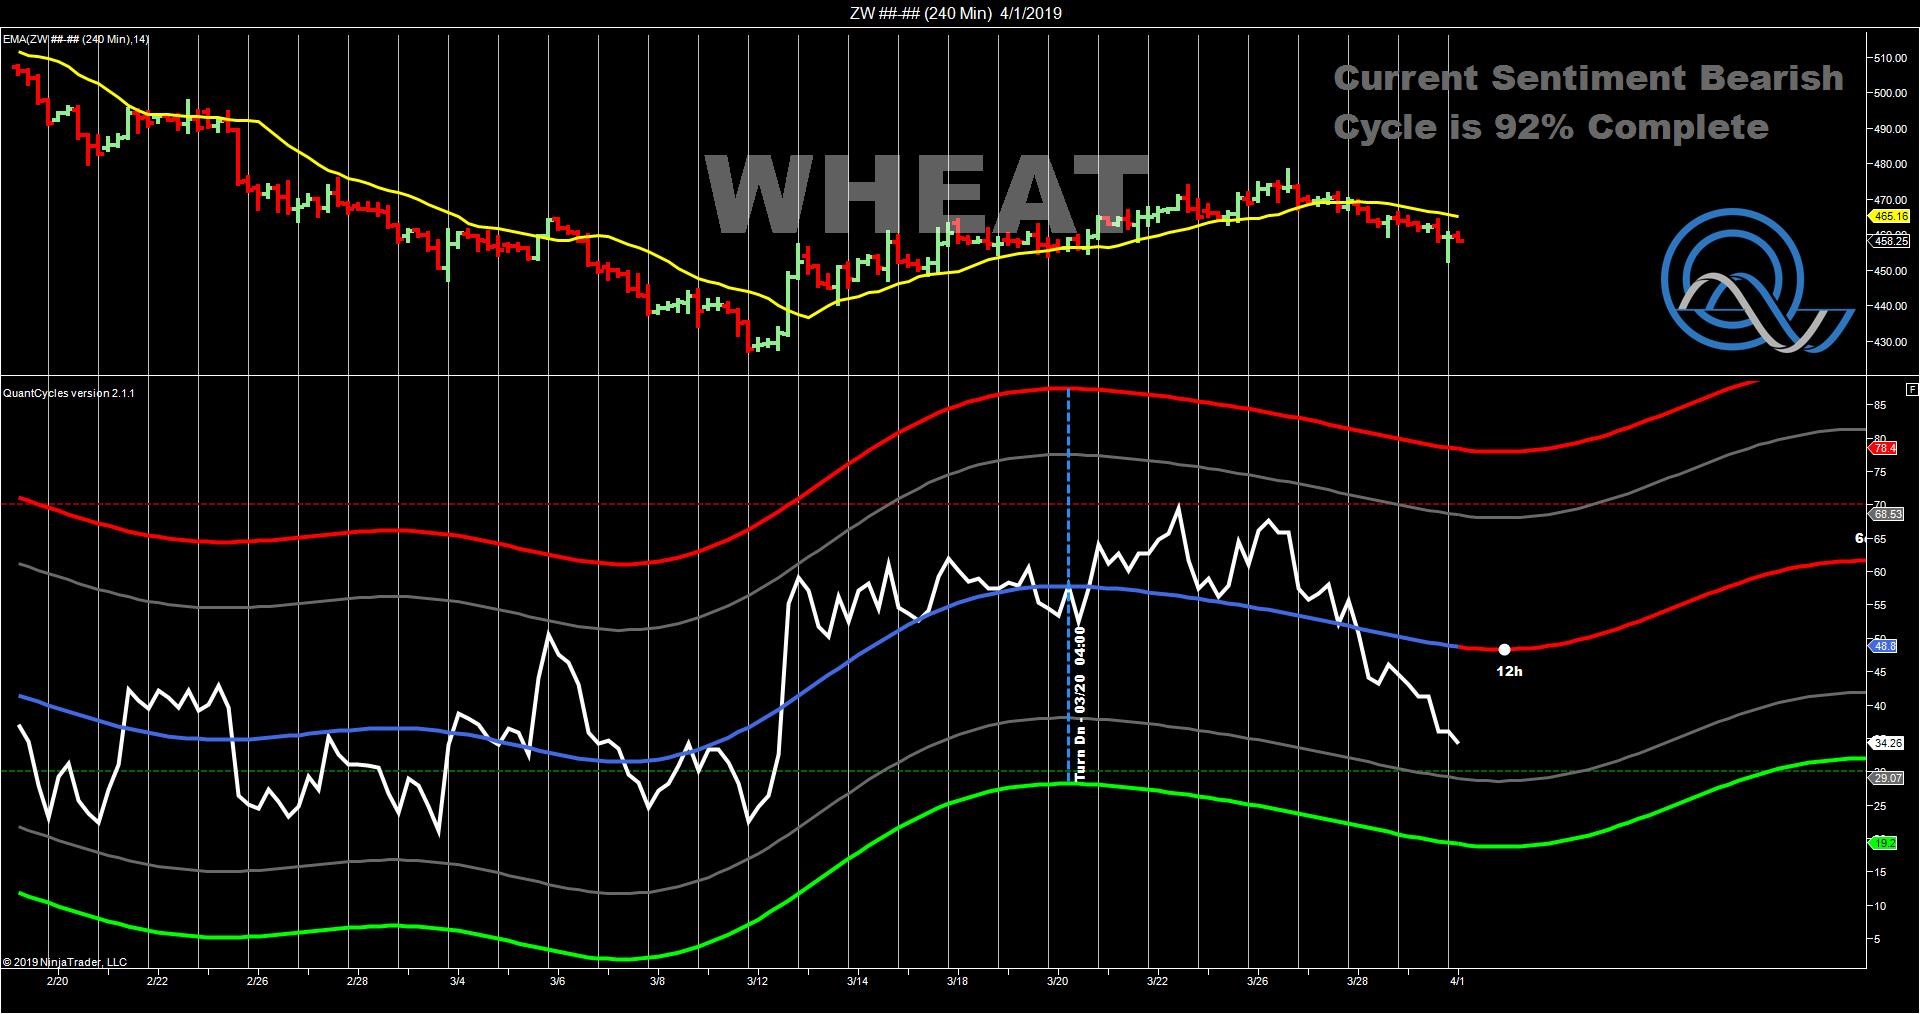
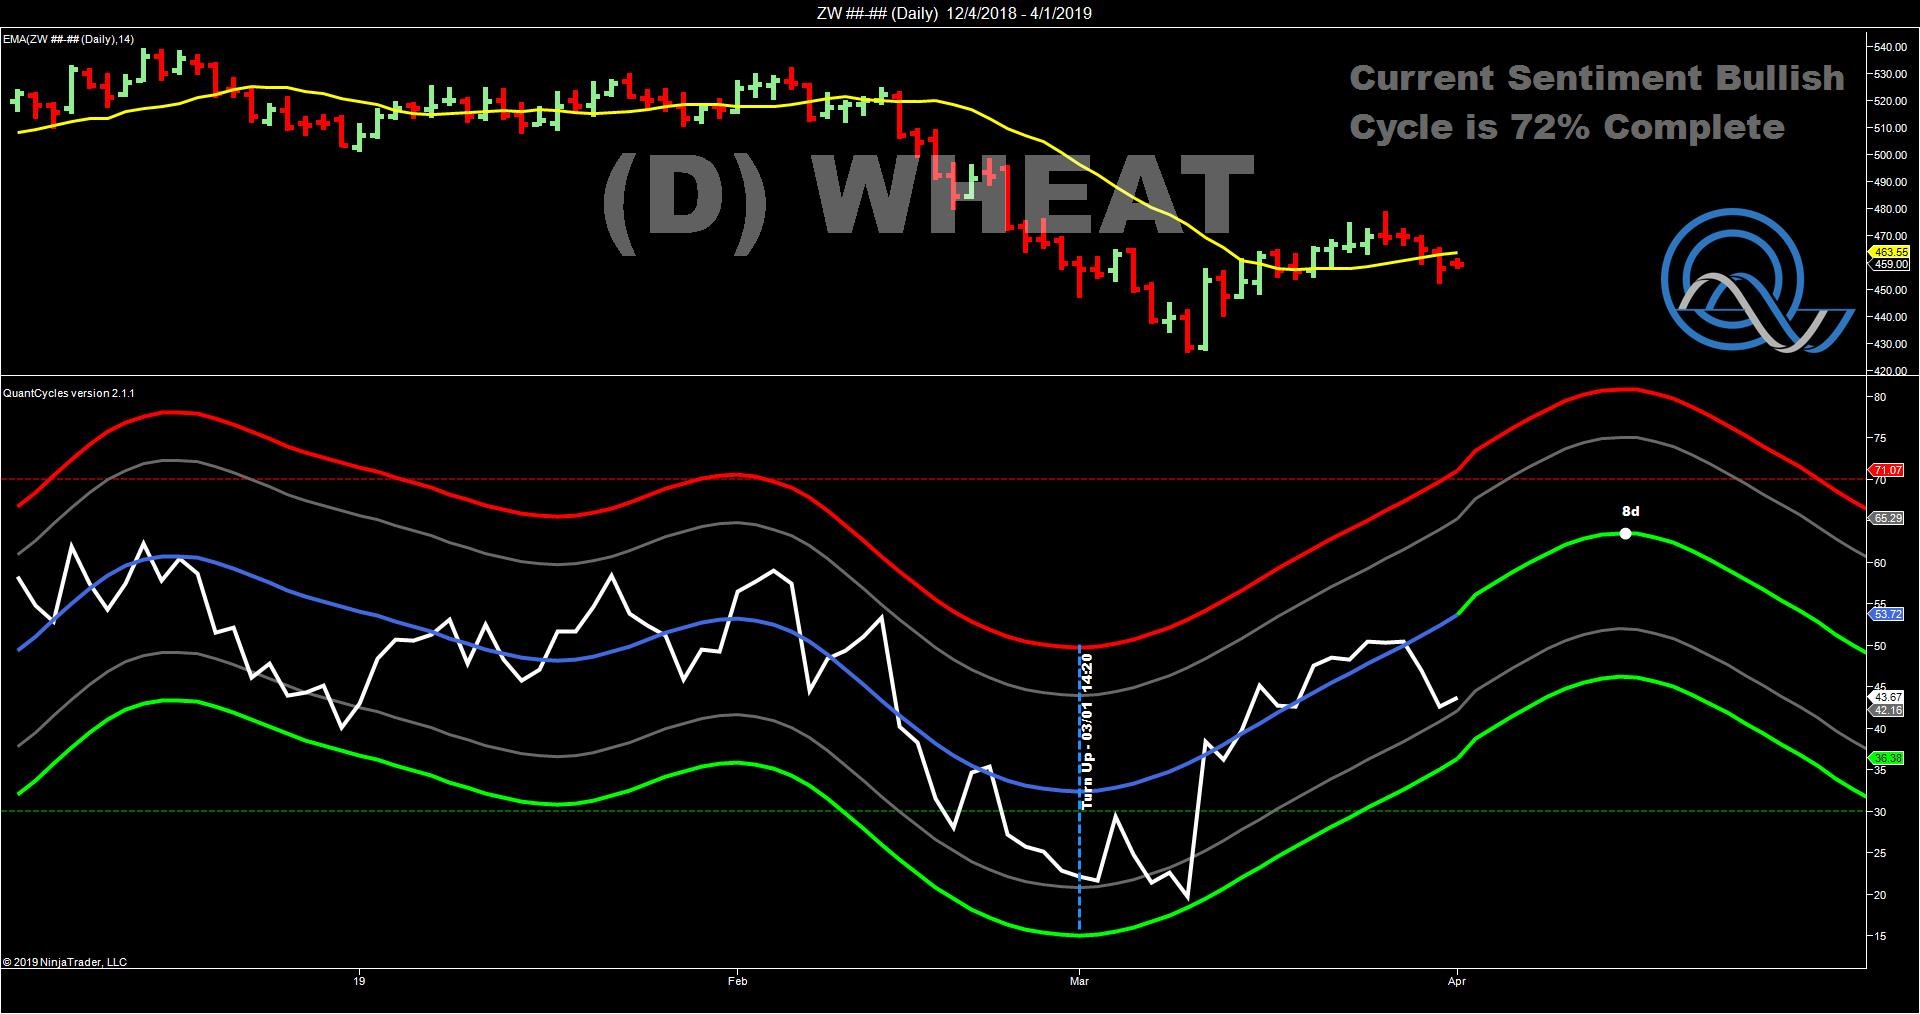
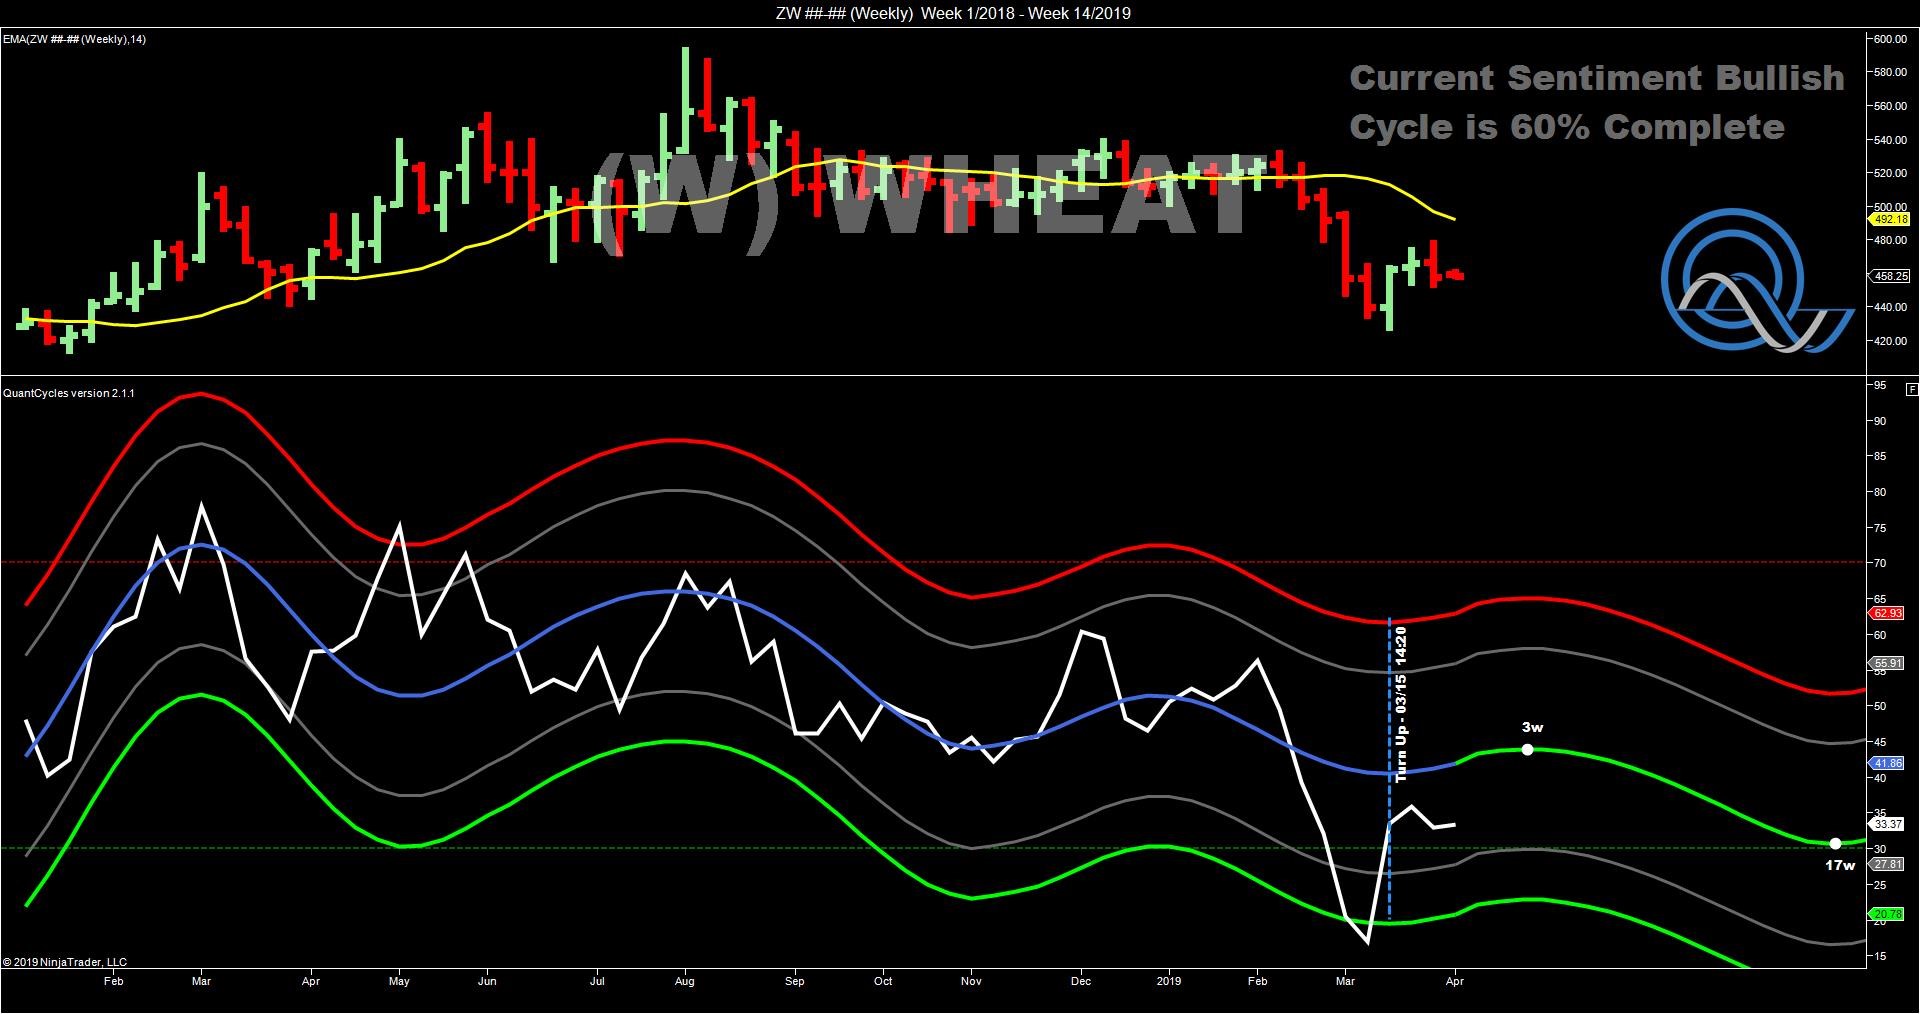
Wheat
There is a solid consensus in the 240-minute, daily and weekly QuantCycle Oscillator in wheat.
All show a bullish tendency, as the 240-minute and daily charts shows wheat somewhat oversold and moving higher.
The daily expects the bullish trend to last about two weekly while the weekly has the market turning lower in three weeks.
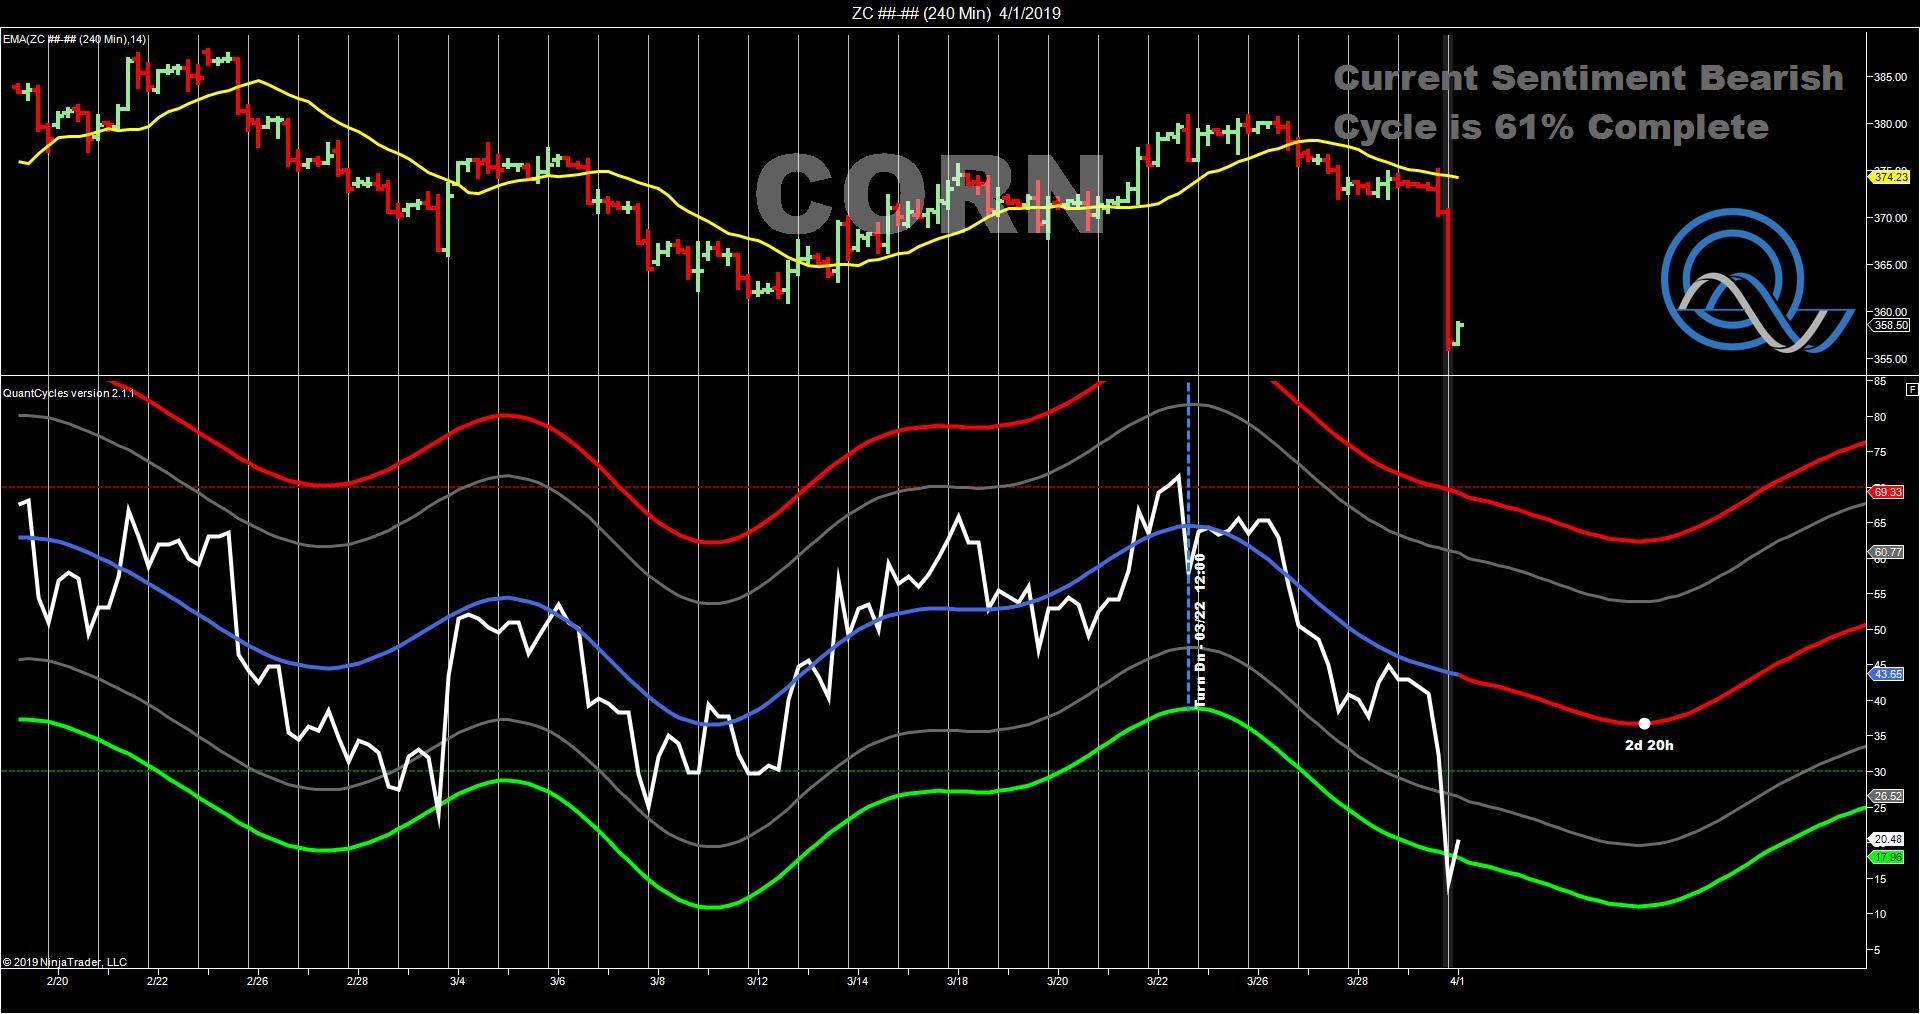
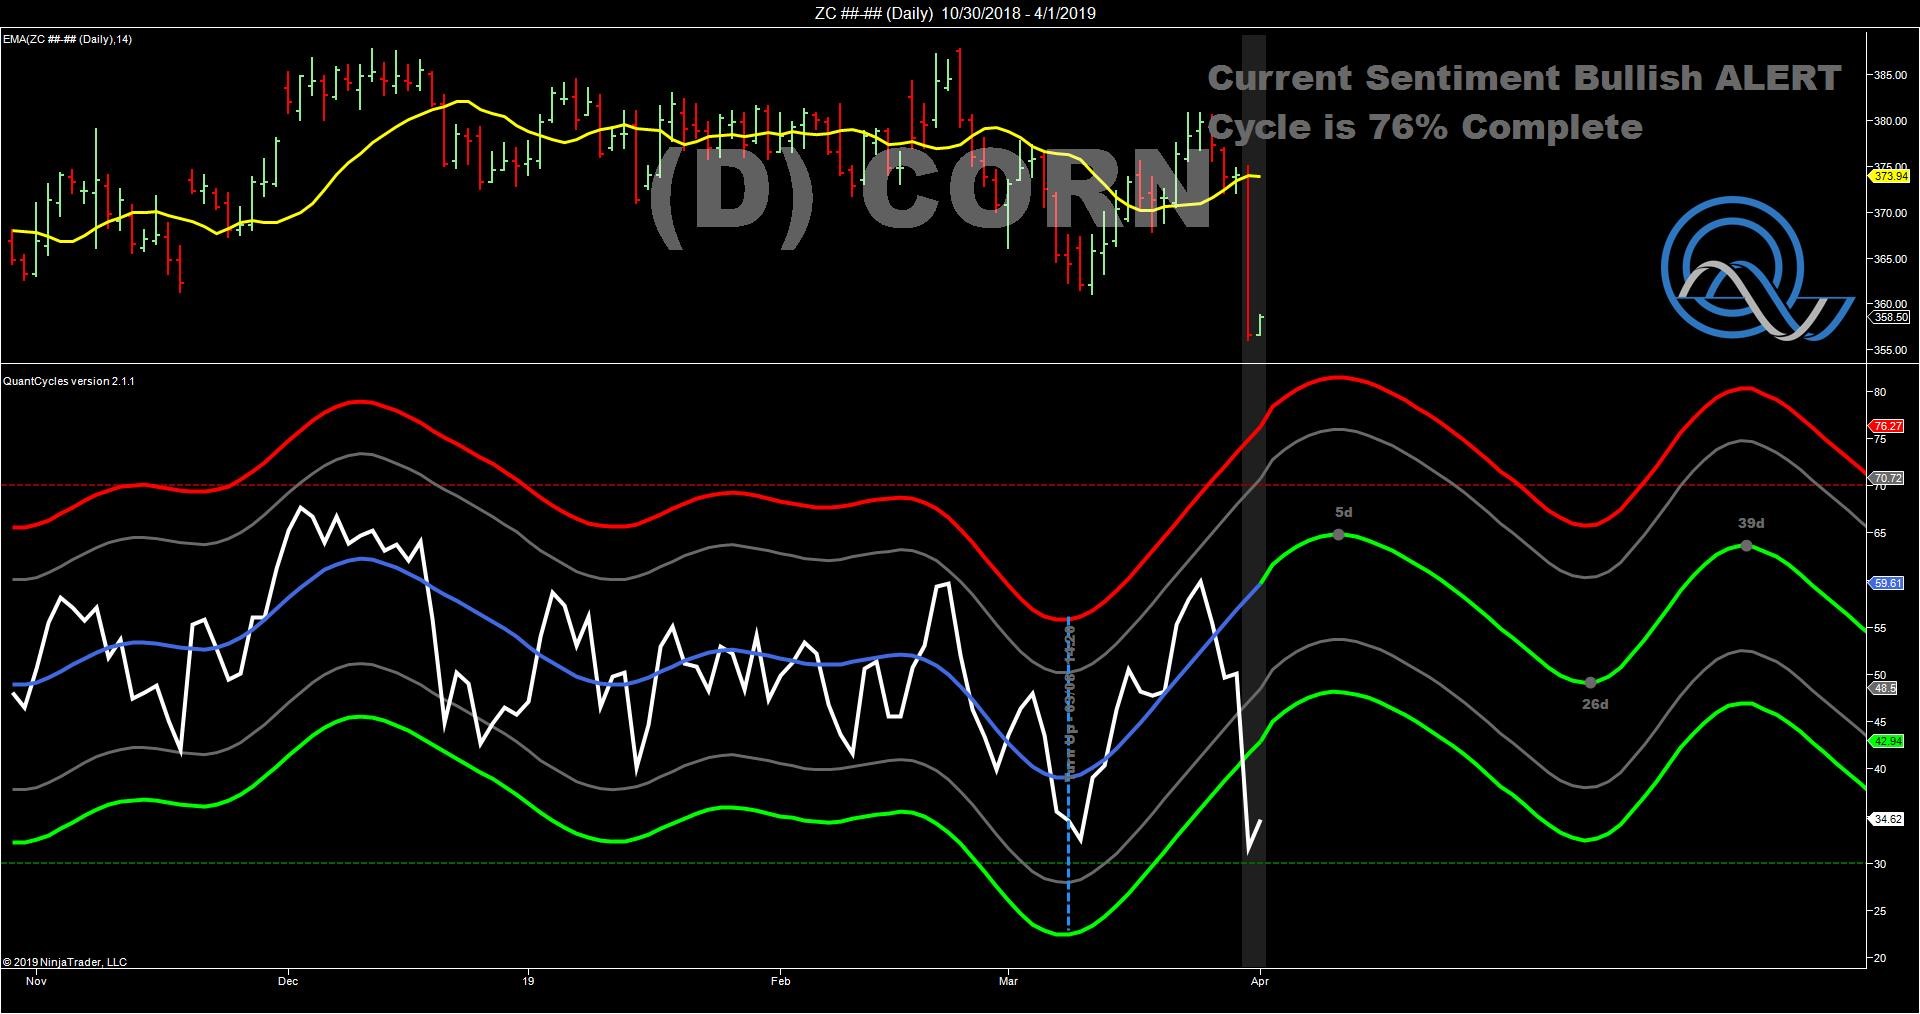
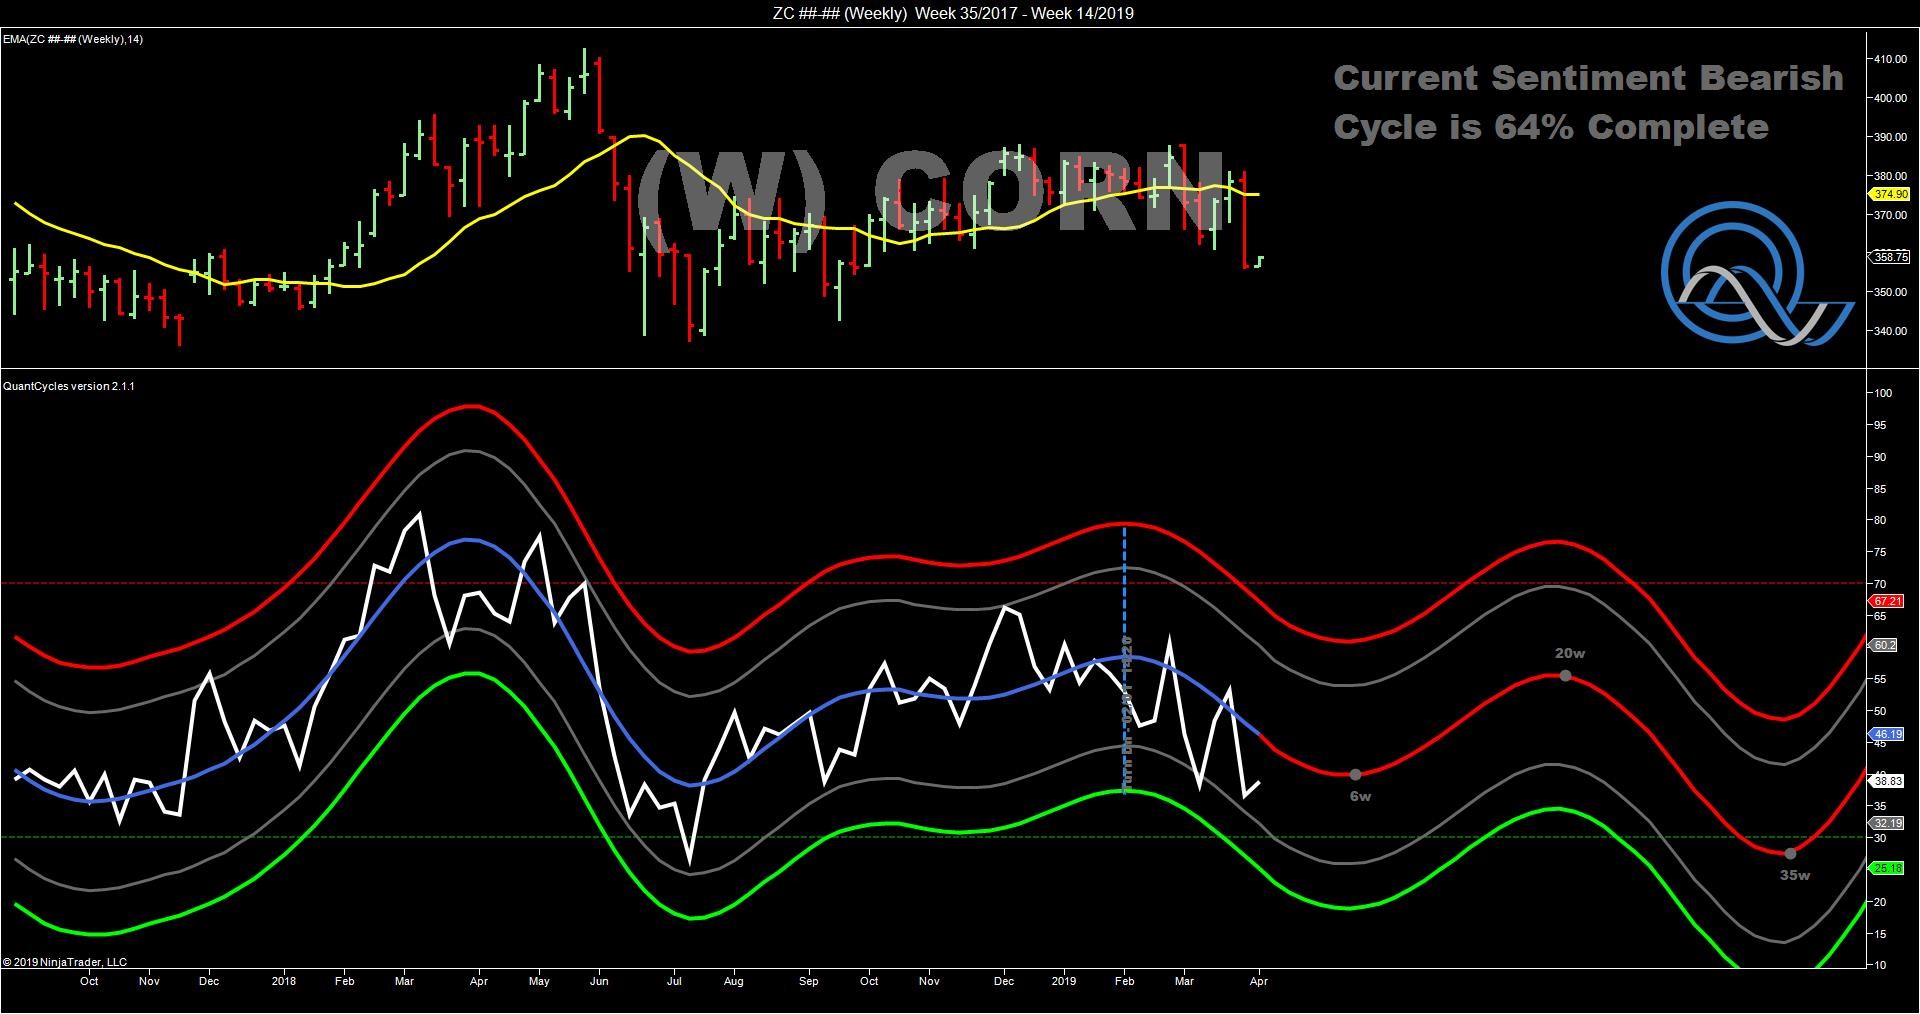
Corn
Corn shows perhaps the strongest opportunity, though there is not a consensus in all the charts.
Both the 240-minunte and daily QuantCycles show that corn is extremely oversold. While the shorter-term charts show continued weakness, the daily shows corn a solid buy and given the oversold nature, we expect corn to rally this week.
The weekly corn short is still pointing lower, but given Friday’s sell-off we expect corn to perform well this week.
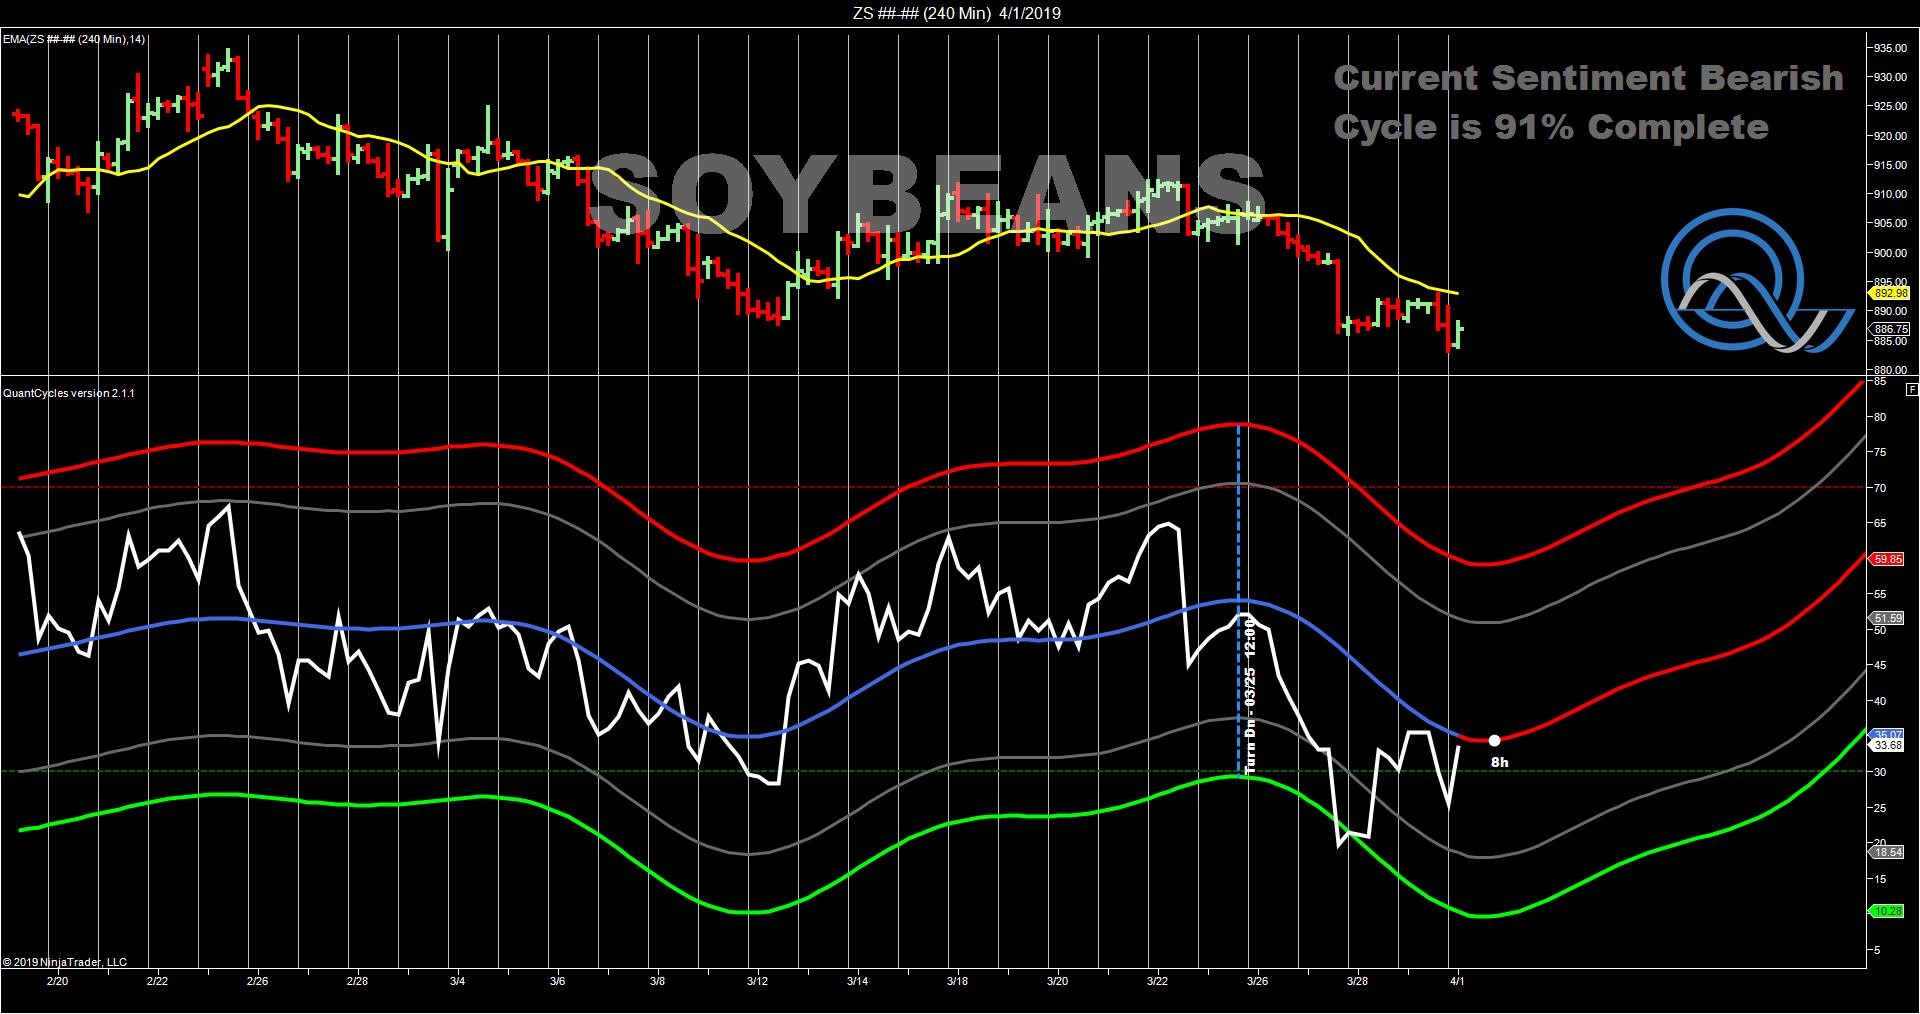
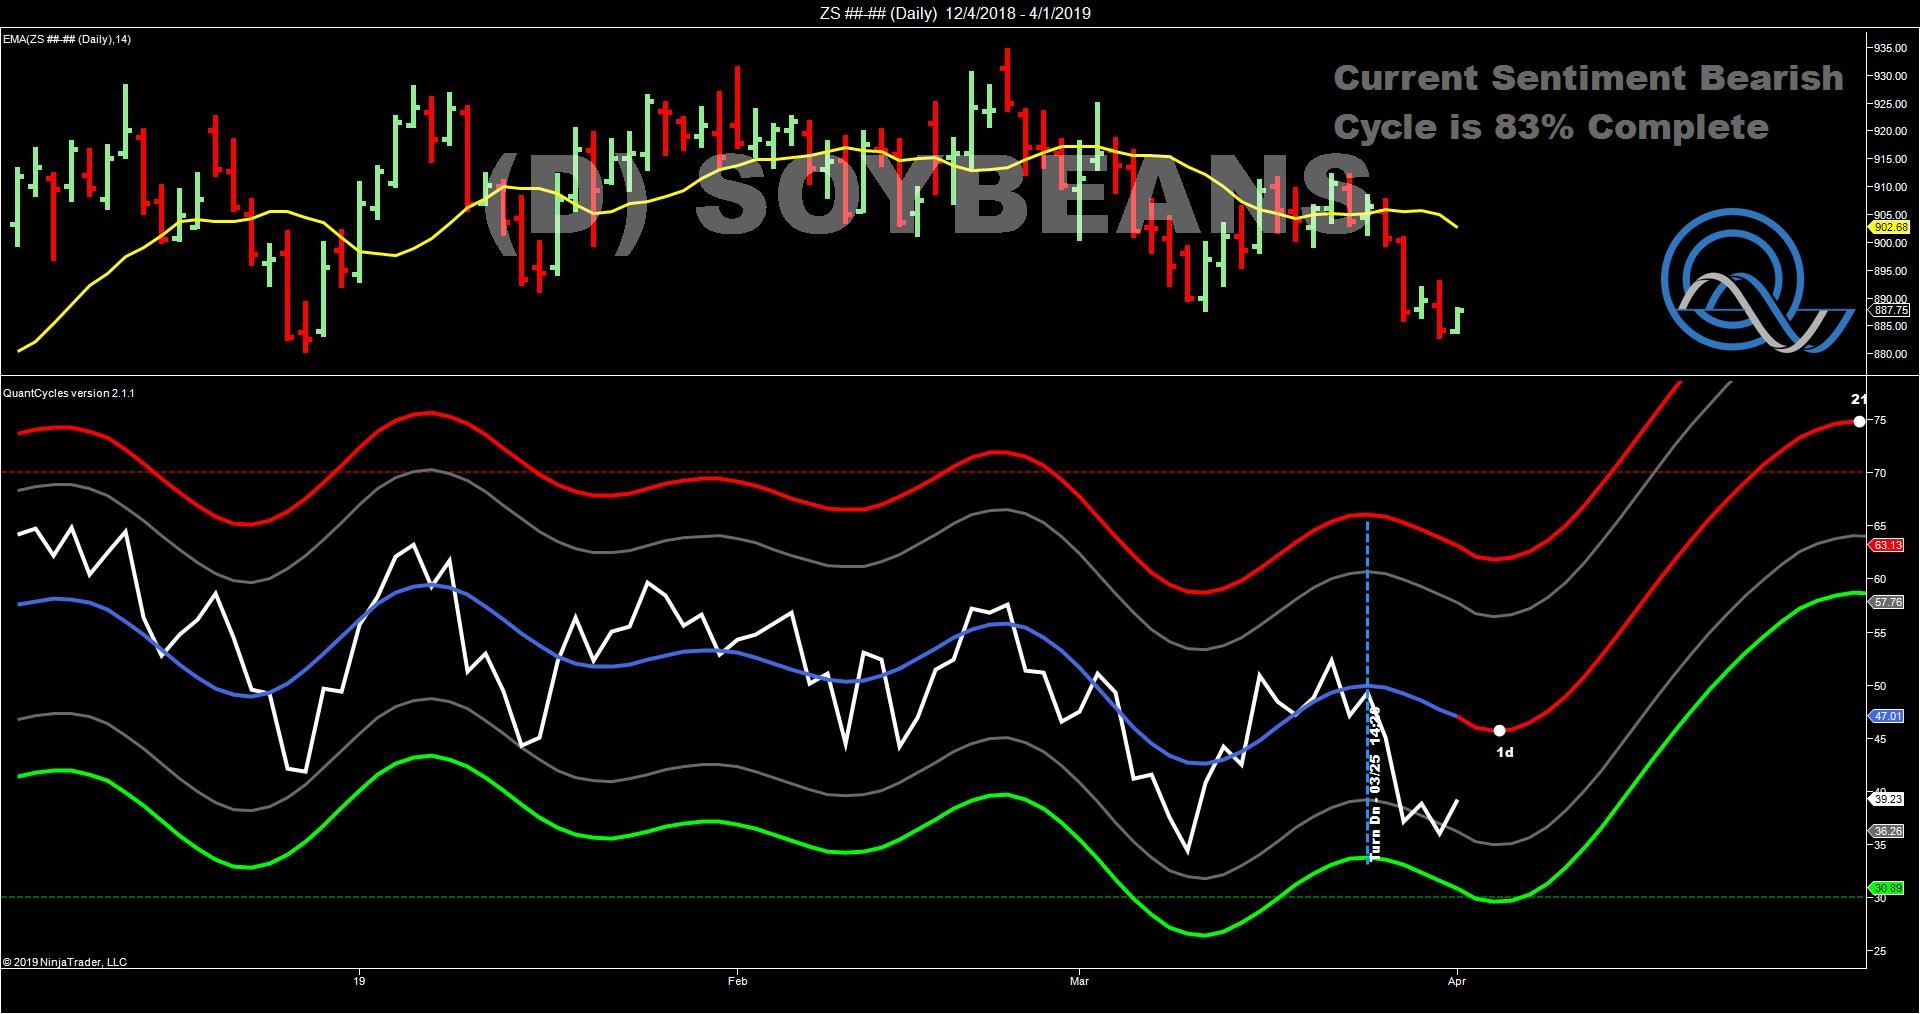
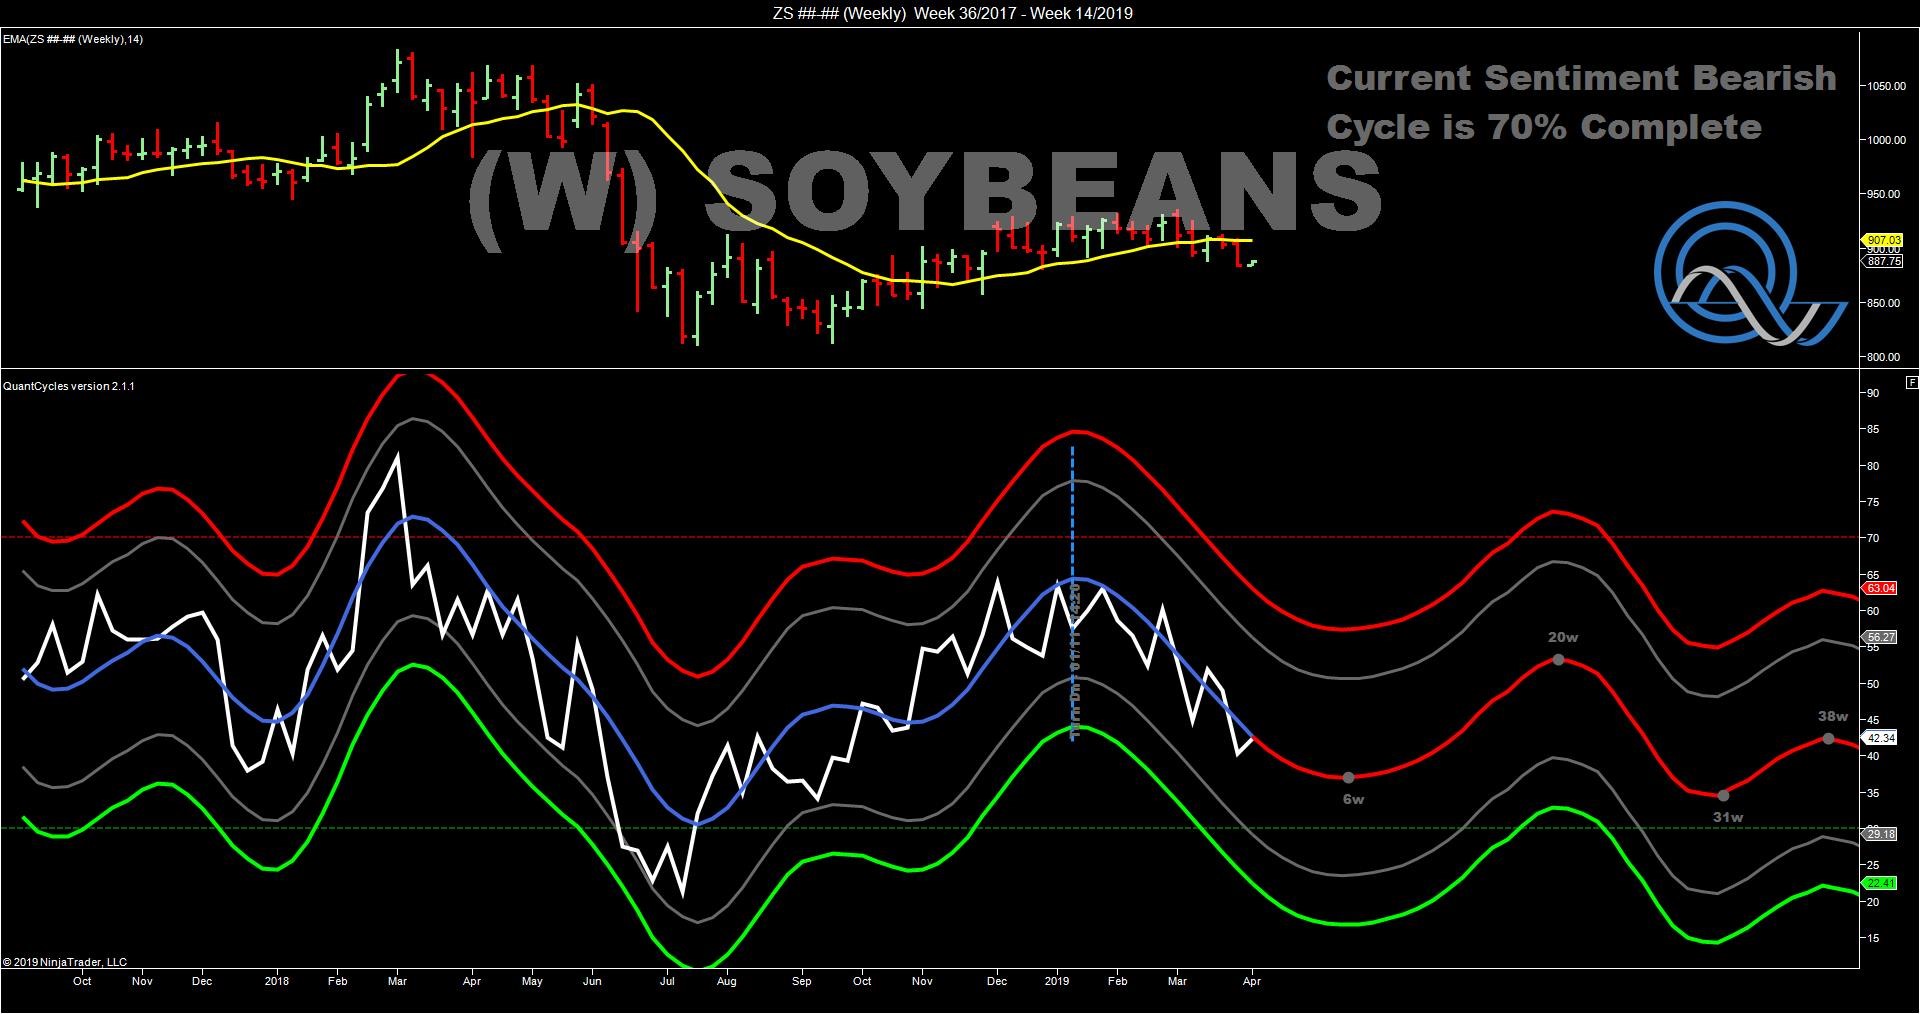
Soybeans </
The 240-minute and daily charts show that soybeans are nearing a significant bottom followed by a strong up move.
The daily chart is the most bullish as it has beans near an extreme oversold level just as it is turning significantly higher.
The weekly shows more time before it hits a bottom. This appears like a strong buying opportunity.
Traders should follow the flooding that has occurred in much of the growing region. We are at a time where short-term fundamentals may take precedence over the cyclical patterns.
If they confirm each other, you should have a strong case for taking a position.
John Rawlins described the value of the QuantCycle Oscillator recently at The Orlando MoneyShow.
The QuantCycle indicator is a technical tool that employs proprietary statistical techniques and complex algorithms to filter multiple cycles from historical data, combines them to obtain cyclical information from price data and then gives a graphical representation of their predictive behavior (center line forecast). Other proprietary frequency techniques are then employed to obtain the cycles embedded in the prices. The upper and lower bands of the oscillator represent a two-standard deviation move from the predictive price band and are indicative of extreme overbought/oversold conditions.


