
An examination of the options price chain in related markets can produce positive trading opportunities, says Paul Cretien.
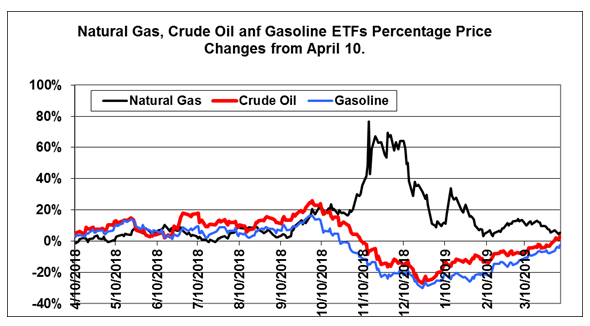
From April 2018 through August of 2018, energy futures and the exchange traded funds (ETFs) following them were relatively quiet. The basically were anywhere between flat and up 20% from their prices in April 1, 2018 price, not a big move for this sector. Then, in November 2018 natural gas exploded up by 60% while crude oil and gasoline fell to 20%. As shown in the chart below, ETFs on natural gas, U.S. Natural Gas Fund (UNG); crude oil, U.S. Oil Fund LP (USO) and Gasoline, U.S. Gasoline Fund LP (UGA) all retraced to where they were a year earlier by April 2019.
The chart show the potential for a huge reversion trade earlier this year as the three markets moves close together for more than six months and have moved back in line after a huge divergence. The question now is: Will the recent strength persist or is the current rally out of fuel?
The energies do not stay quiet for long. The QuantCycle Oscillator charts of the energy complex shows the recent moves and predictive in the complex. So how can traders profit from potential volatility this powerful group?
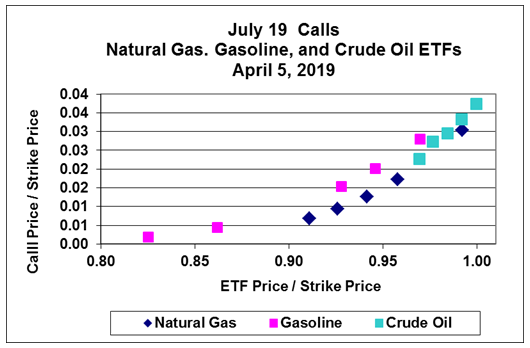
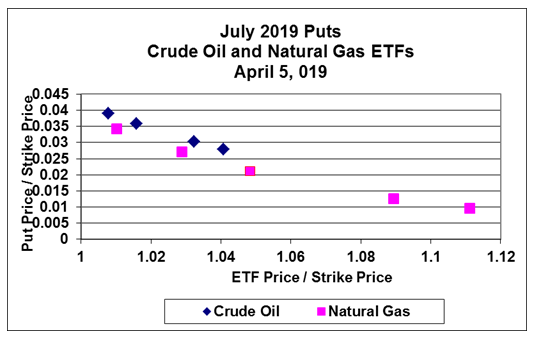
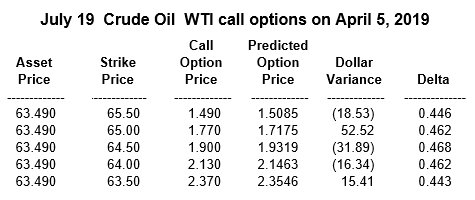
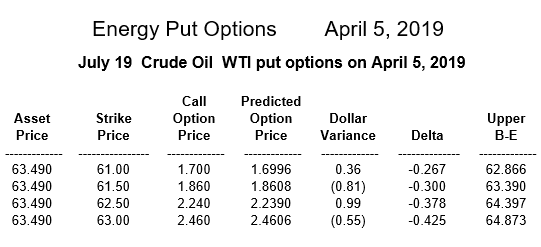
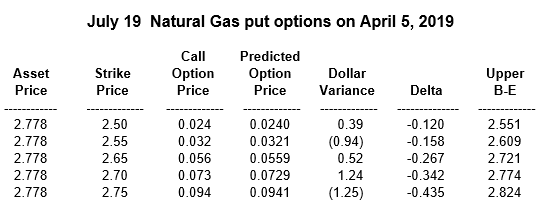
One way to play this sector is through options. The charts below showing the July 19 Calls and July 19 Puts illustrate that the options price curves are close together, meaning that none of the energies are separated due to expected price volatility. This is surprising in view of the large price movement by natural gas in late 2018. The options market is not expecting a return to that surge in the price of natural gas.
The two tables below (Energy Call Options and Energy Put Options) permit us to see the amount of variance of puts and calls from predicted price curves. The numbers are based on options price chains published by Barchart.com on April 5, 2019. The put options are a little short because there are no puts in the gasoline option price chain. The absence of gasoline put options is related to the total put and call premiums for gasoline — $478.80 for puts and $116,692.80 for calls. Put open interest is 202 while call open interest is 1,270.
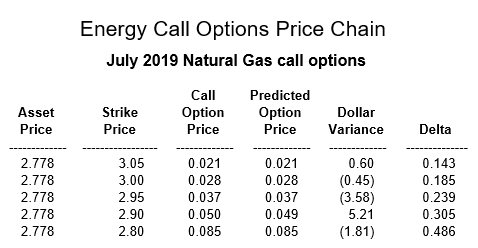
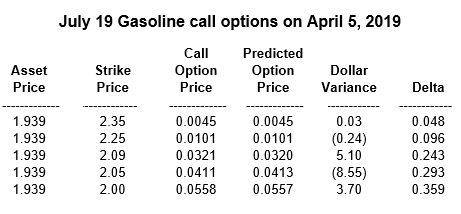
Taking a hint from the options market, we might buy gasoline calls. “Energy Call Options” shows that the July 19 2.05 strike is underpriced by 8.55 on April 5. This call option or another call that is reasonably priced would coincide with the current options market opinion.
Several crude oil options look underpriced on April 5. For example the 64.50 strike has a variance from the predicted price curve of minus $31.69.
We are depending on the price-sensitive traders in the options market to tell us what they think of the near-term future for energy futures, ETFs and options.
As we can tell from the initial price chart, gauging when prices get out of line is a great opportunity to make a reversion trade.


