
John Rawlins breaks down the long and short-term QuantCycle analysis of the energy sector.
The energy complex has gained a lot of attention of late, especially crude oil and the rising price of gasoline. We thought it would be a good time to take a look at the products across the complex starting with a long-term look.
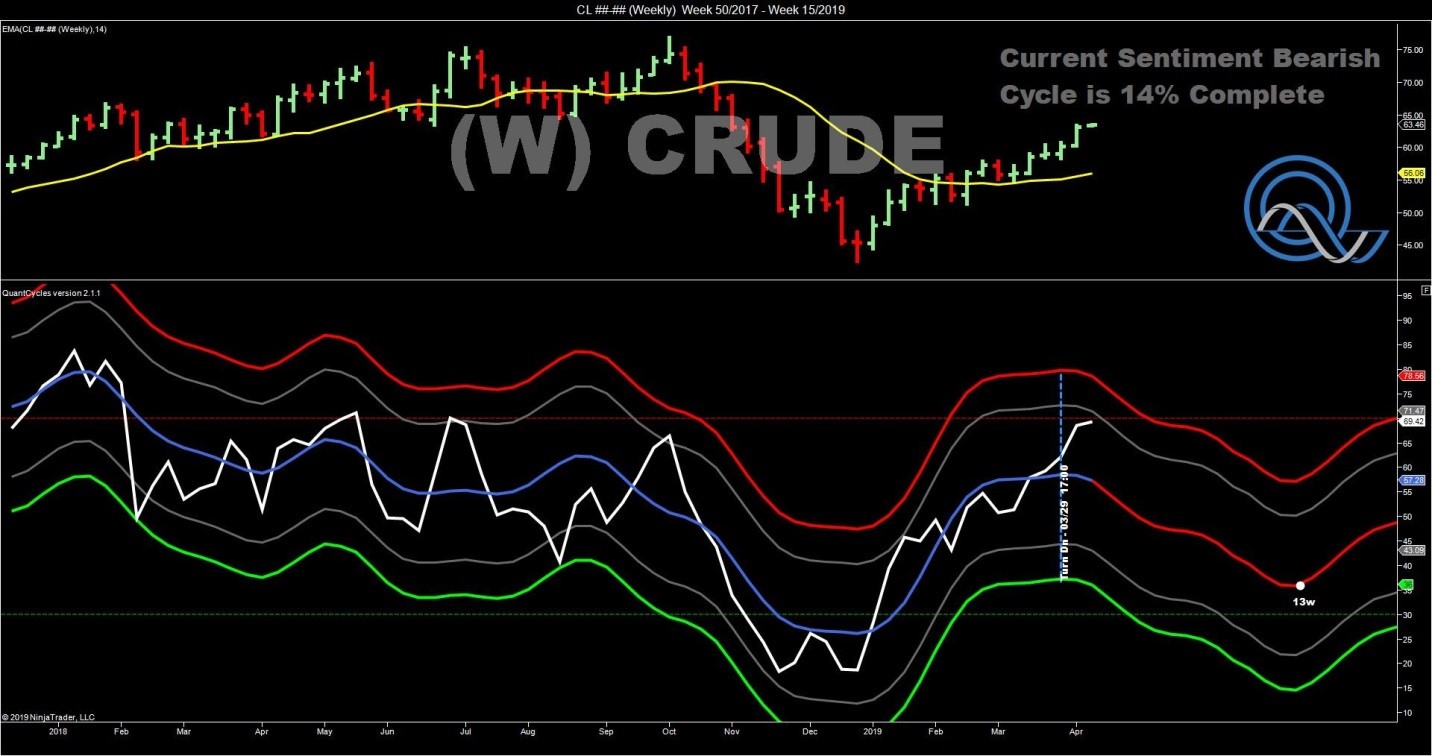
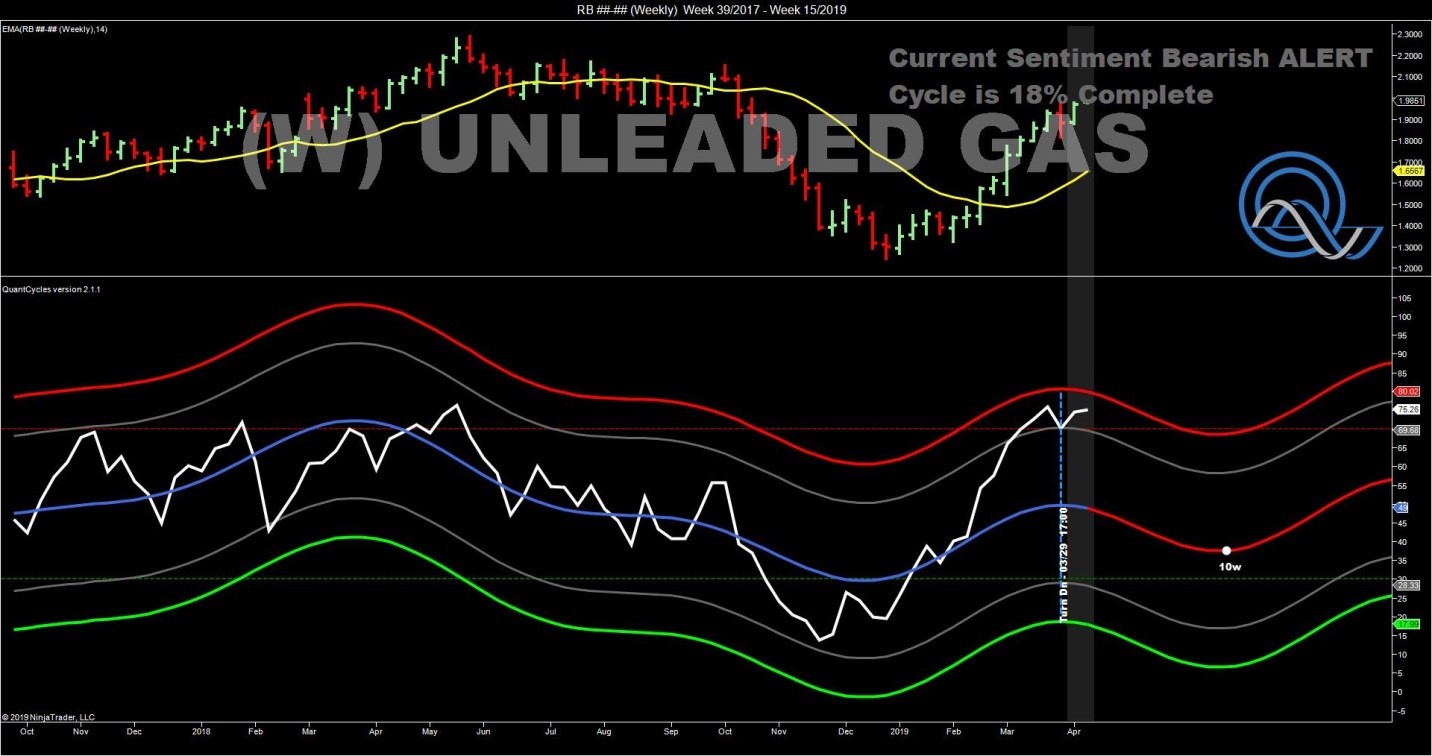
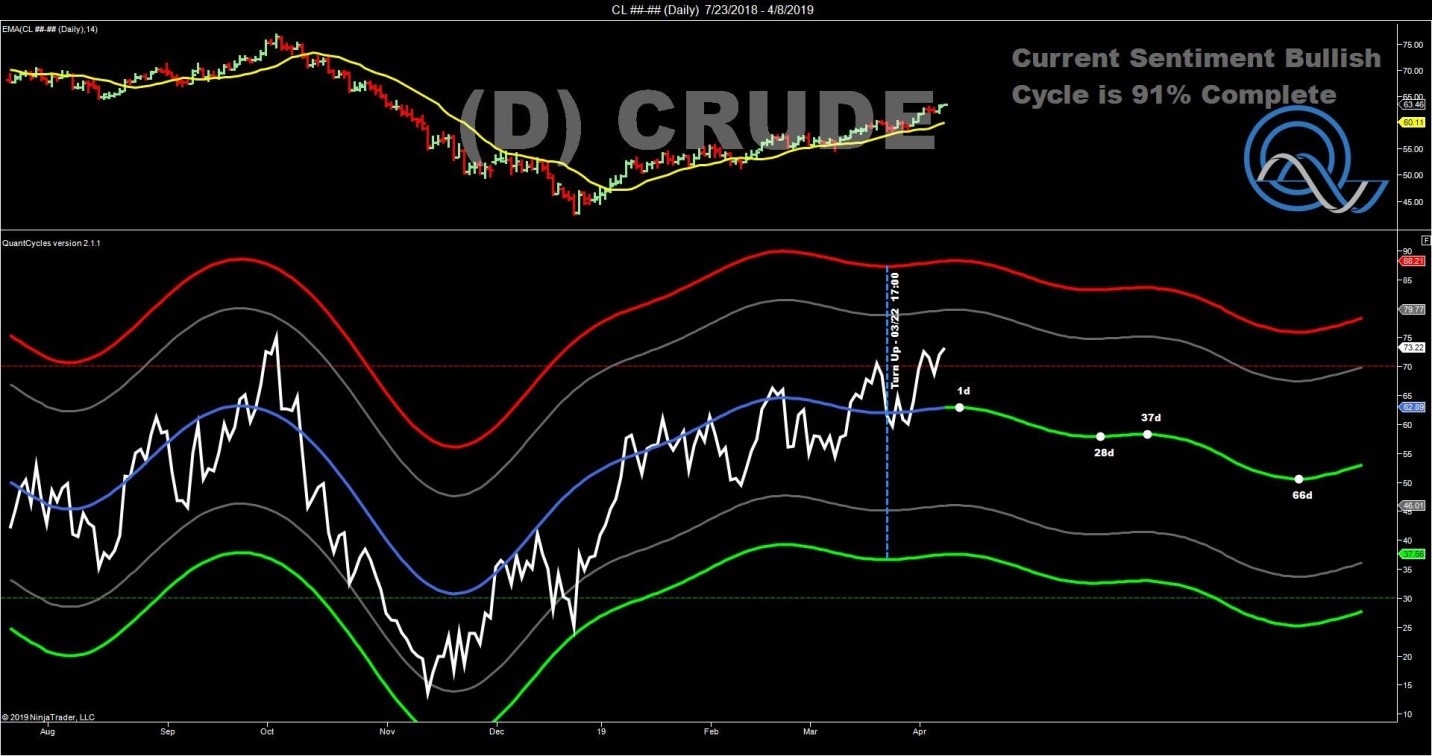
All of the major products—crude oil, natural gas and unleaded gasoline appear to be at extreme levels. Crude oil and unleaded gasoline has continued to rally in recent weeks, despite the QuantCycle Oscillator indicating weakness. This move has pushed these two markets near extreme overbought territory on the weekly QuantCylce chart.
Traders should be alert, as the QuantCycle is indicating a significant move lower, especially in crude oil.
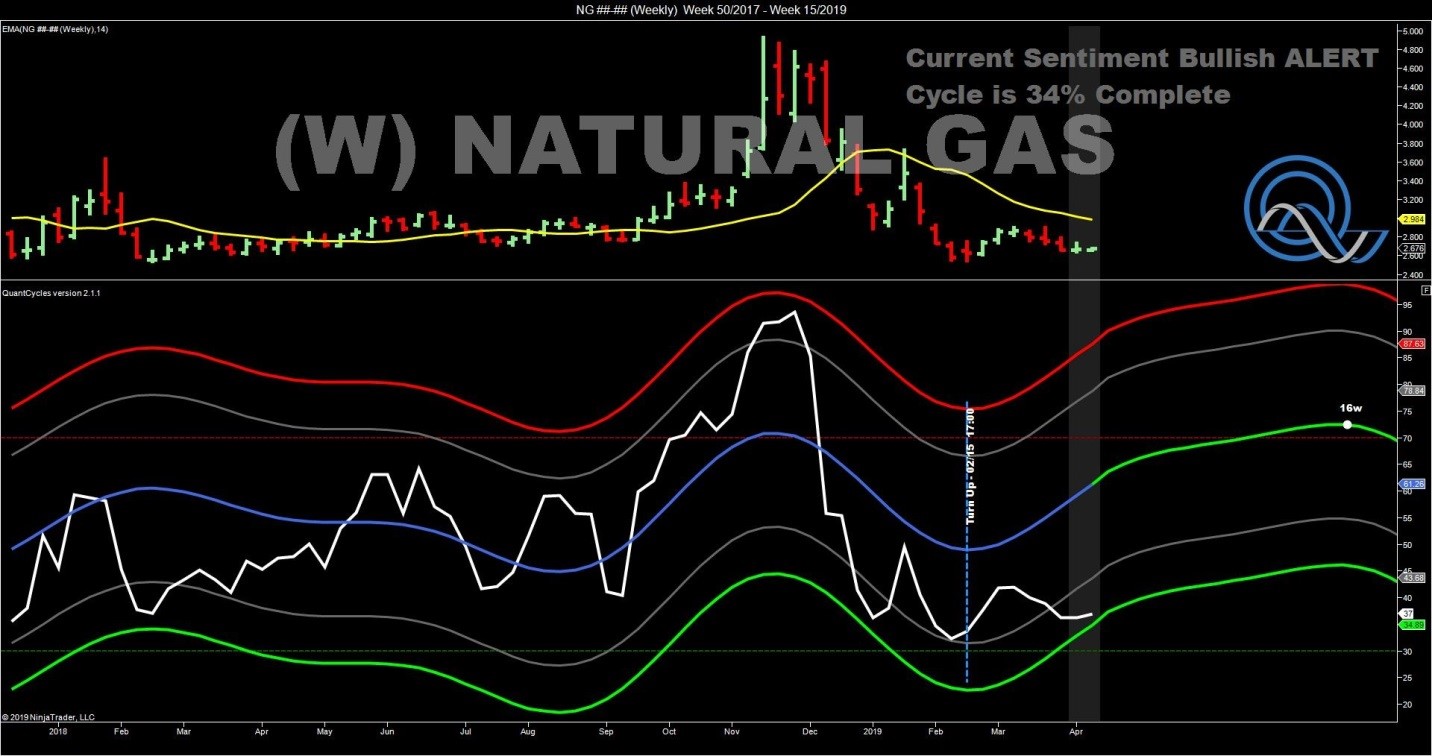
Natural gas, on the other hand, is approaching extreme oversold territory. It began to move lower, consistent with the QuantCycle analysis, but flattened out in the last couple of weeks moving it into oversold territory.
Short-term Look
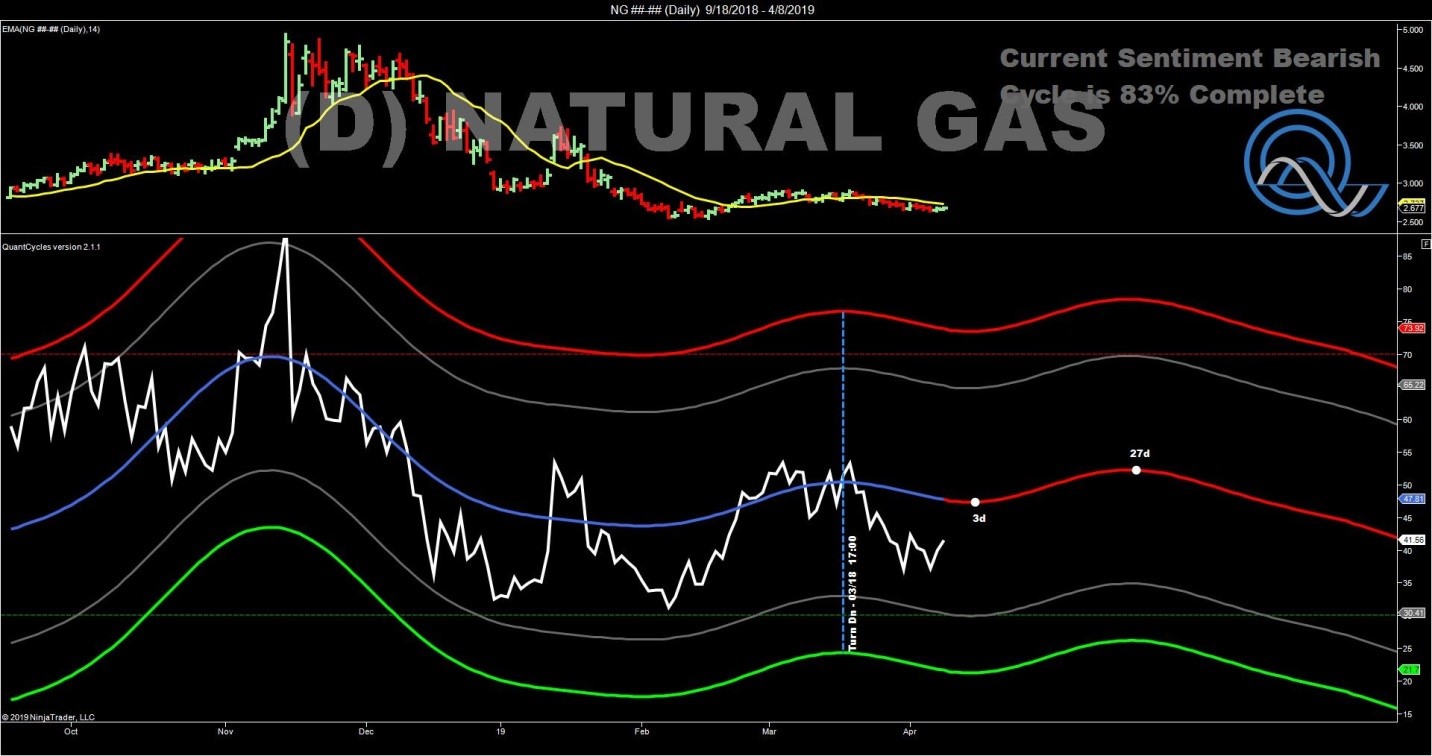
While these are interesting and potentially actionable indicators, we need to drill down into the short-term to confirm a signal.
Unfortunately there is no confirming signal in the natural gas or even crude oil market. Natural gas appears flat in the daily QuantCycle for a couple of weeks before turning moderately lower.
The shorter-term crude oil chart shows weakness in the days and weeks ahead, but nothing dramatic.
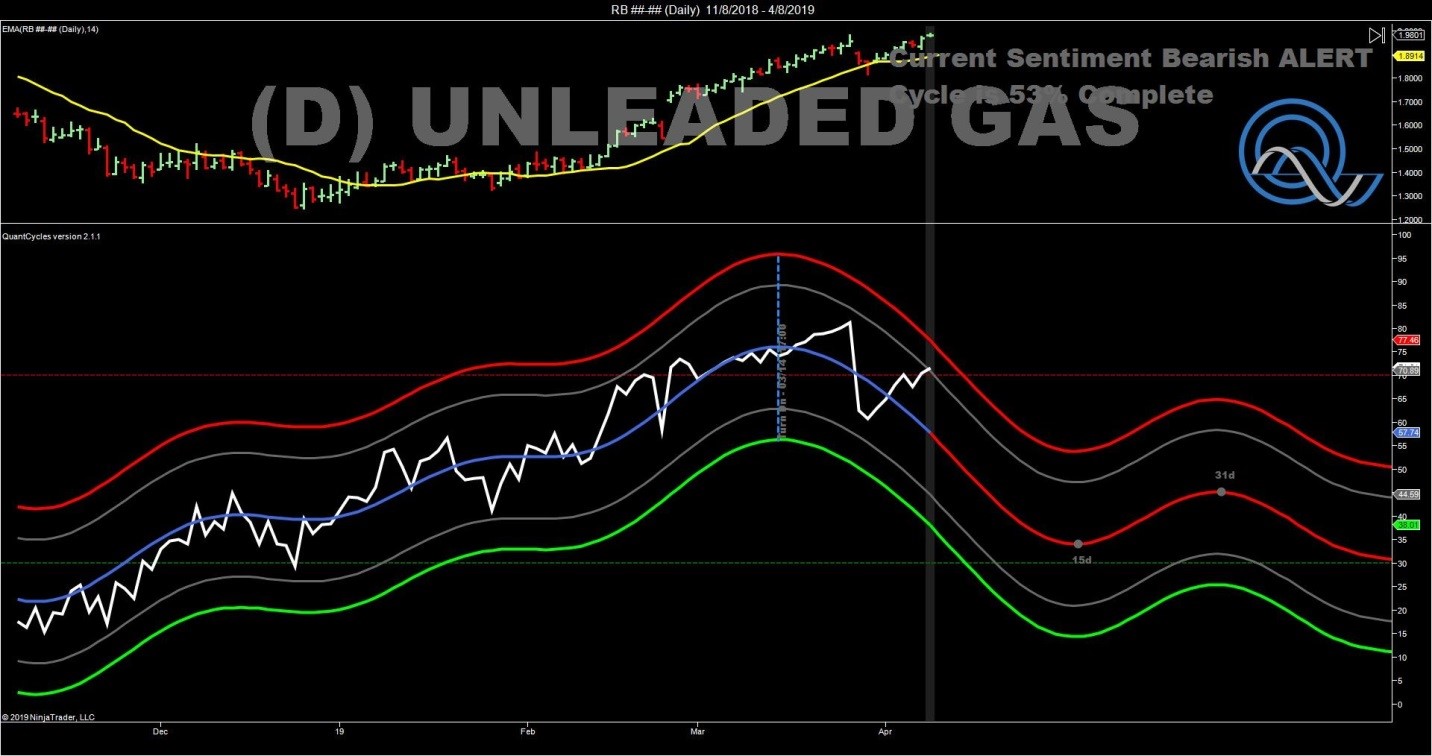
Unleaded Gas Sell
The unleaded gasoline daily QuantCycle chart is a match and a strong confirmation of a sell signal. This weakness should persist for the next three weeks.
John Rawlins described the value of the QuantCycle Oscillator recently at The Orlando MoneyShow.
The QuantCycle indicator is a technical tool that employs proprietary statistical techniques and complex algorithms to filter multiple cycles from historical data, combines them to obtain cyclical information from price data and then gives a graphical representation of their predictive behavior (center line forecast). Other proprietary frequency techniques are then employed to obtain the cycles embedded in the prices. The upper and lower bands of the oscillator represent a two-standard deviation move from the predictive price band and are indicative of extreme overbought/oversold conditions.


