
Chart cycle patterns can reveal a lot, here Suri Duddella explains how a rounded bottom projects a bullish move in Bitcoin.
by Round-Bottom (also known as a U-bottom or saucer bottom) Patterns that have long-range bases with a slightly softer 'U' shaped curve format. This soft U-shaped curve than resembles a bowl ensures it is a consolidation base rather than a “V” pattern. The round bottom's patterns differ with the traditional “Cup with Handle” patterns as the round-bottom pattern is a shallow pattern with a long base and usually appears at the end of a downtrend. Round Bottom Patterns exhibit an accelerated growth after completing a long range base.
In 2019, Bitcoin appears to have entered into a new phase of the bull market as its prices bottomed near $3,100. Since January 2019, Bitcoin started to show sideways to positive trend signals (eSIX trend indicator) and started its ascend in a round-bottom pattern. In April 2019, Bitcoin prices traded above $4,250 to signal its initial breakout from the trading range. Round-Bottom Patterns are long term reversal patterns, and its initial target within the pattern is near the lip (where prices began its downtrend into the pattern) at $6,500 (see chart).
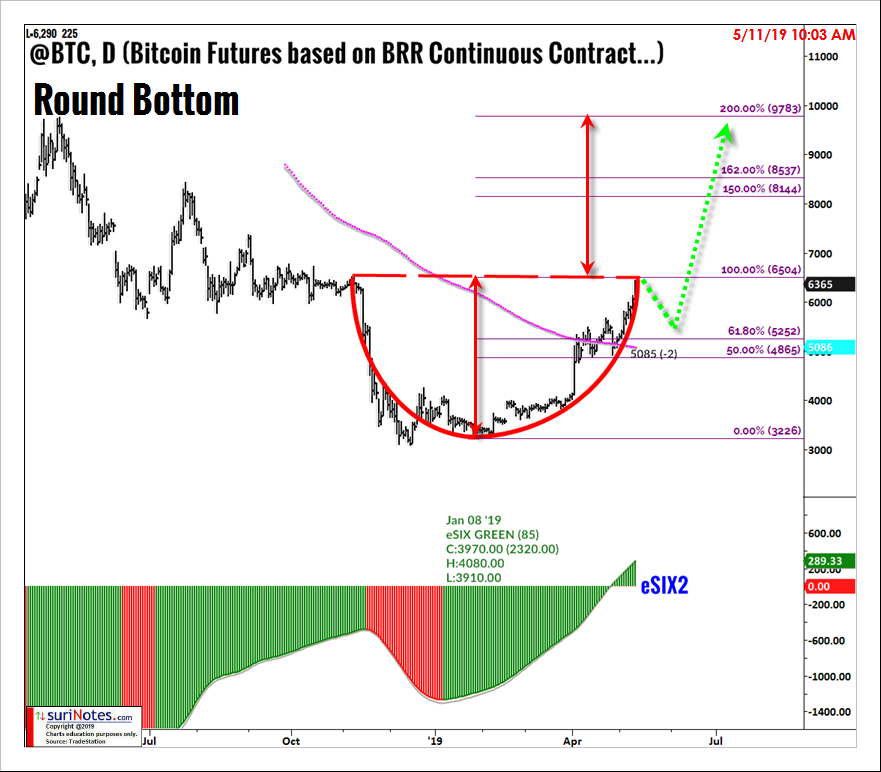
Once price reaches its initial target level, it may see some pullback (shown in green line) towards 200-day simple moving average ($5,200) before starting its next rally. The next target ranges after its breakout from the edge of the pattern ($6,500) is the depth of the pattern ($6,500 to $3,100) projected to $9,785. The Round-Bottom, Cup with Handle and Parabolic Arc patterns are long term patterns and could take months to reach its target zones.


