The recent equity rally following the Q4 correction has created numerous V-shaped bottoms. Suri Duddella explains how that can be exploited.
Chart patterns form as a result of knowledge-based bias work in the markets. The learned behavior of traders to buy and sell above and below the key support and resistance levels or around critical price levels (highs, lows, pivots) creates price barriers in the form of trendlines or channels. These barriers become action/reaction lines and form geometric structures (chart patterns). Successful pattern trading requires the knowledge of chart pattern formation, its arrangement and its market manipulation. The recognition of patterns and its body of knowledge of how to react and what to expect helps a trader’s success.
Traders are always analyzing trends and reversals. Their eternal question for traders is: Can the trend continue? Knowing trends and trend reversals are critical for traders’ success, but it is a difficult proposition to predict trend continuation or reversal accurately. Chart patterns classification of “continuous” or “reversal” patterns helps traders to identify specific patterns and expect their outcome from current price action.
Traders move prices between key support and resistance areas (a tug of war) as their perception shifts between optimism and pessimism. This movement of price adhering to key support and resistance areas creates chart patterns. Reversal patterns exhibit a total shift of trends from bullish to bearish or bearish to bullish in a single pattern structure. Examples of the reversal patterns are Head and Shoulders, Double Tops and Bottoms and Spike Patterns (V-Patterns). A knowledge of reversal patterns helps traders to estimate the end of trends to execute trades in a timely fashion for maximum gains. This knowledge also helps traders to time the trades in the opposite direction and to place smaller stop levels.
One of the key reversal patterns is the "V Chart Pattern. Here we present examples of how to trade it. Please note, all V-patterns are classified as a bullish "V-Bottom" and complimentary bearish patterns ("V-Top").
V Patterns
As the name implies, the "V" chart patterns have the letter "V" shape and prices shift their momentum from an aggressive sell-off to aggressive rally in its structure. It is relatively a rare pattern with extreme angles and maybe not easy to recognize until it is mostly formed, which is why we do not attempt to predict the initial reversal. The V-Pattern is a powerful reversal pattern seen in all markets, all time-frames and in all instruments. The "V" pattern consists of rapid price action and may not be suited for all casual investors. The "V" patterns are formed when its trend is sharply switched from bearish to bullish (in case of V-Bottom) or bullish (or sideways) to bearish (in case of V-Top patterns).
Trading V-Patterns
The critical aspect of the V pattern is it must have a sharp downtrend followed by a quick and sharp uptrend reversal. Look for a 1-3 bar reversals at the bottom of the pattern to signify the sharp reversal process. The volume increases during both the phases of the breakdown (down-shift momentum) and breakout (up-shift momentum). There are a few ways to trade this pattern, but the most conservative way is to trade a long entry once the pattern is complete and retraced back to the neckline (as a pullback). Aggressive traders may enter on the trendline breakouts at the bottom, but the success rate with simple trendline breakouts is low (52%) compared to the neckline breakout (64%) reaching its first target range 62% of its size from breakout level (see chart).
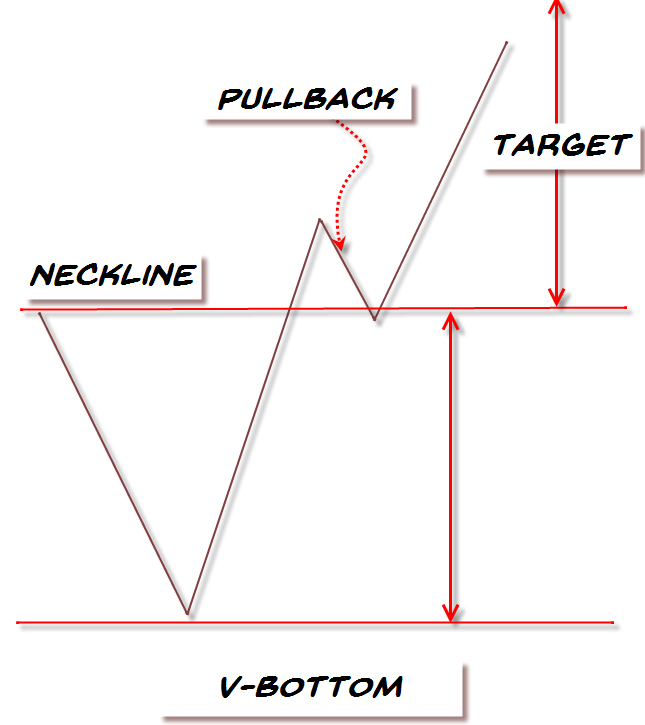
The key factors of the pattern identification:
1. Sharp Downtrend
2. Sharp Uptrend
3. V shaped Pattern (usually 1-3 bars reversals)
4. Volume increase in both breakdown and breakout phases
5. Breakout over neckline
6. Pullback to the Neckline
7. Target
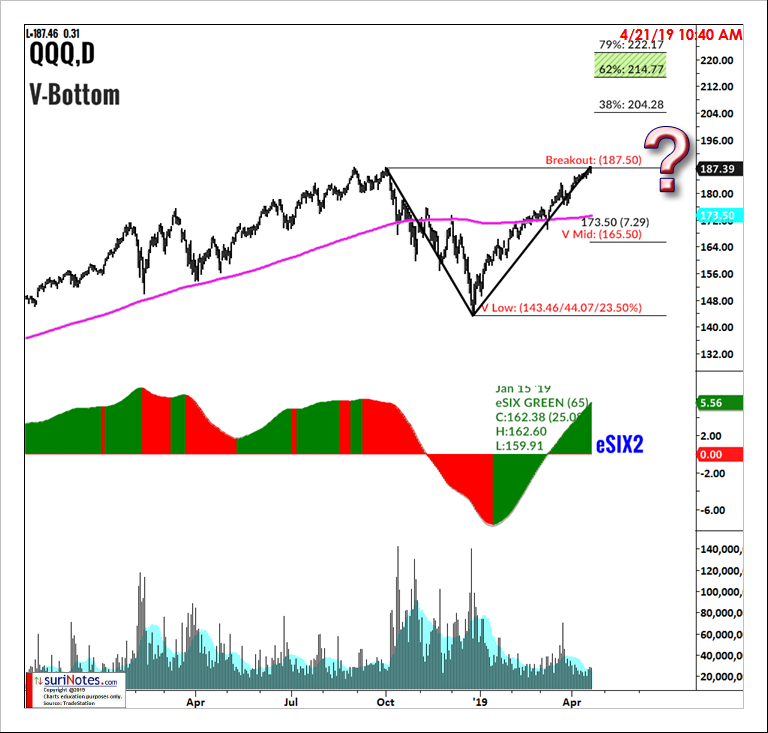
Recently the Powershares QQQ Trust ETF (QQQ) formed a V-Bottom pattern on its daily chart and is trading near the neckline (see chart). Volume on both breakdown and breakout was high. Continue to watch the underlying trend to confirm the breakout above the neckline for a long trade.
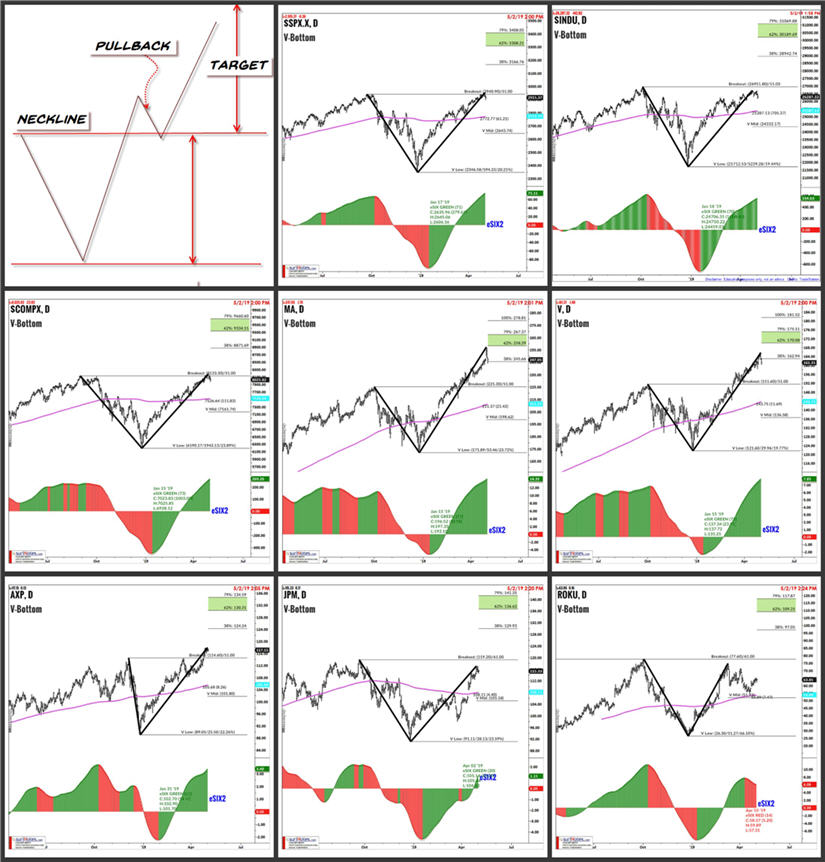
The sharp Q4 equity correction followed by the subsequent rally in the first quarter of 2019 has provided a plethora of V-shaped patterns among the major stock indexes and correlated markets. The chart below shows the current emerging V bottom patterns as of May 2 in the S&P 500, Nasdaq Composite , Dow Jones Index, Mastercard Inc. (MA), Visa (V), American Express (AXP) and JPMorgan (JPM).