Pharmaceutical giant Pfizer Inc. (PFE) has sold off sharply since announcing plan to spinoff its Upjohn unit, pushing into extreme oversold territory.
Equity markets took a turn for the worst this week. First the market reacted unenthusiastically to the quarter percent Federal Reserve’s Open Markets Committee (FOMC) Fed Funds rate cut after Chair Jerome Powell failed to commit to a broader easing cycle. The next day President Trump, who voiced disappointment in the Fed’s decision as not strong enough, announced he would impose a 10% tariff on $300 billion of Chinese goods on Sept. 1. This hit markets again.
One stock hit particularly hard—though perhaps unrelated to the major headlines — was Pharmaceutical giant Pfizer Inc. (PFE). Pfizer has had its own problems, on recent weak earnings and downgrades due to its planned spinoff of its Upjohn unit, which will merge with Mylan NV (MYL).
Pfizer loses a portfolio of drugs that are no longer patent protected including Viagra.
While Pfizer’s weakness is related to specific fundamental problems, its selloff had put it in extreme oversold territory based on the QuantCycles Oscillator.
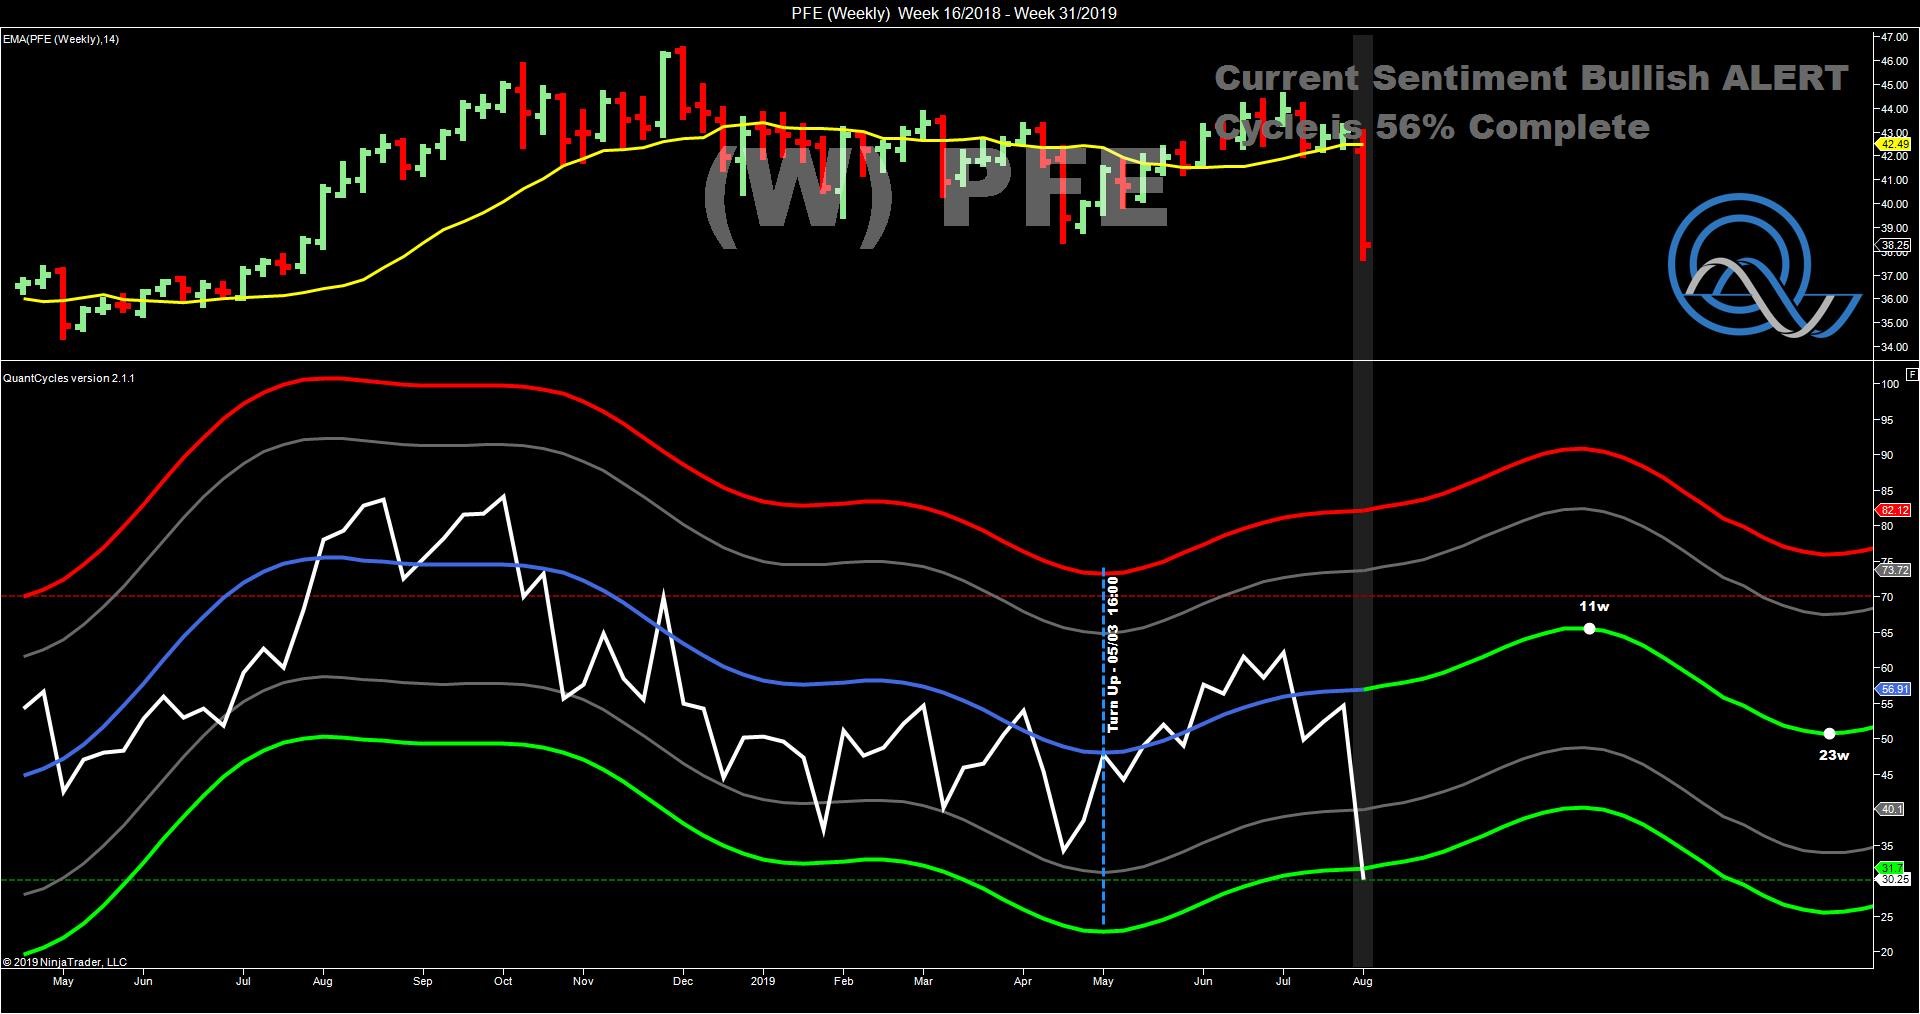
Pfizer has been in a QuantCycles uptrend since May, and the recent sharp selloff has pushed the weekly oscillator into major oversold territory, with the uptrend expected to continue for nearly three months (see chart).

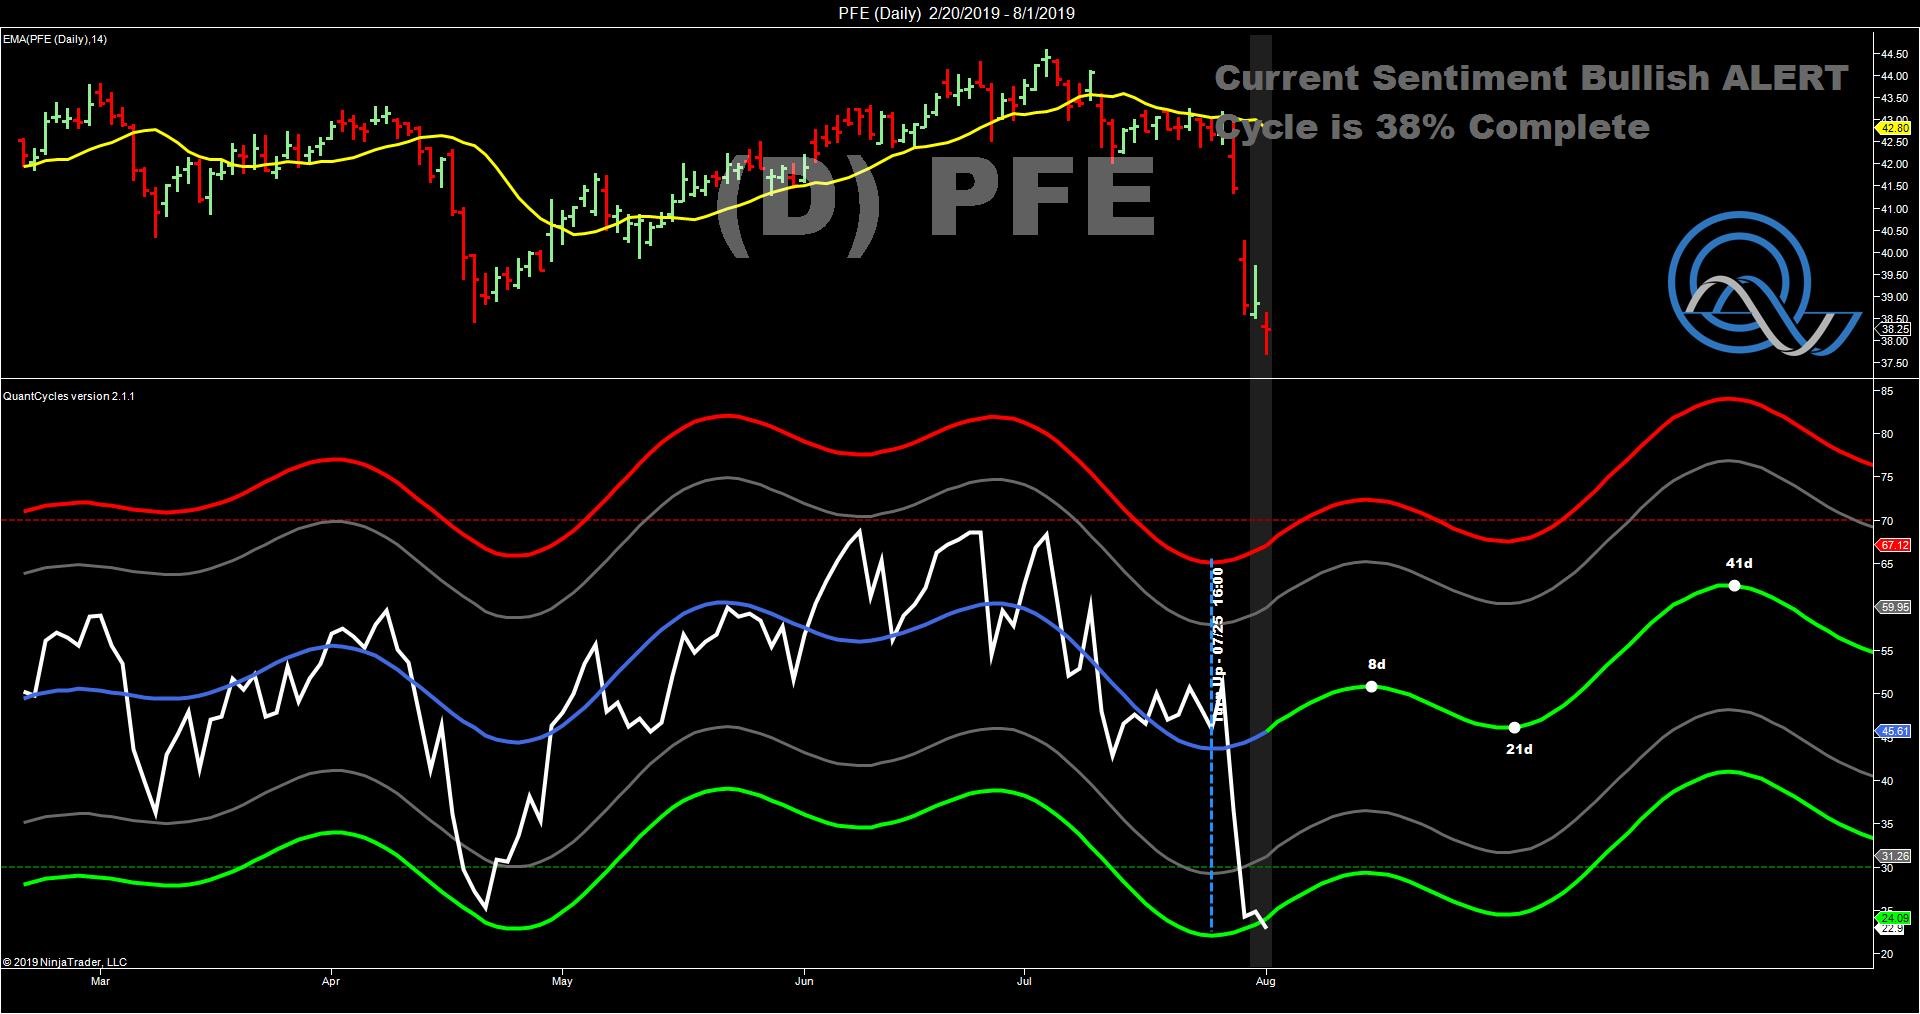
The daily oscillator turned positive more recently and had more upside to go. Even after a near-term top is hit in two weeks, the oscillator remains relatively bullish for more than a month (see chart).

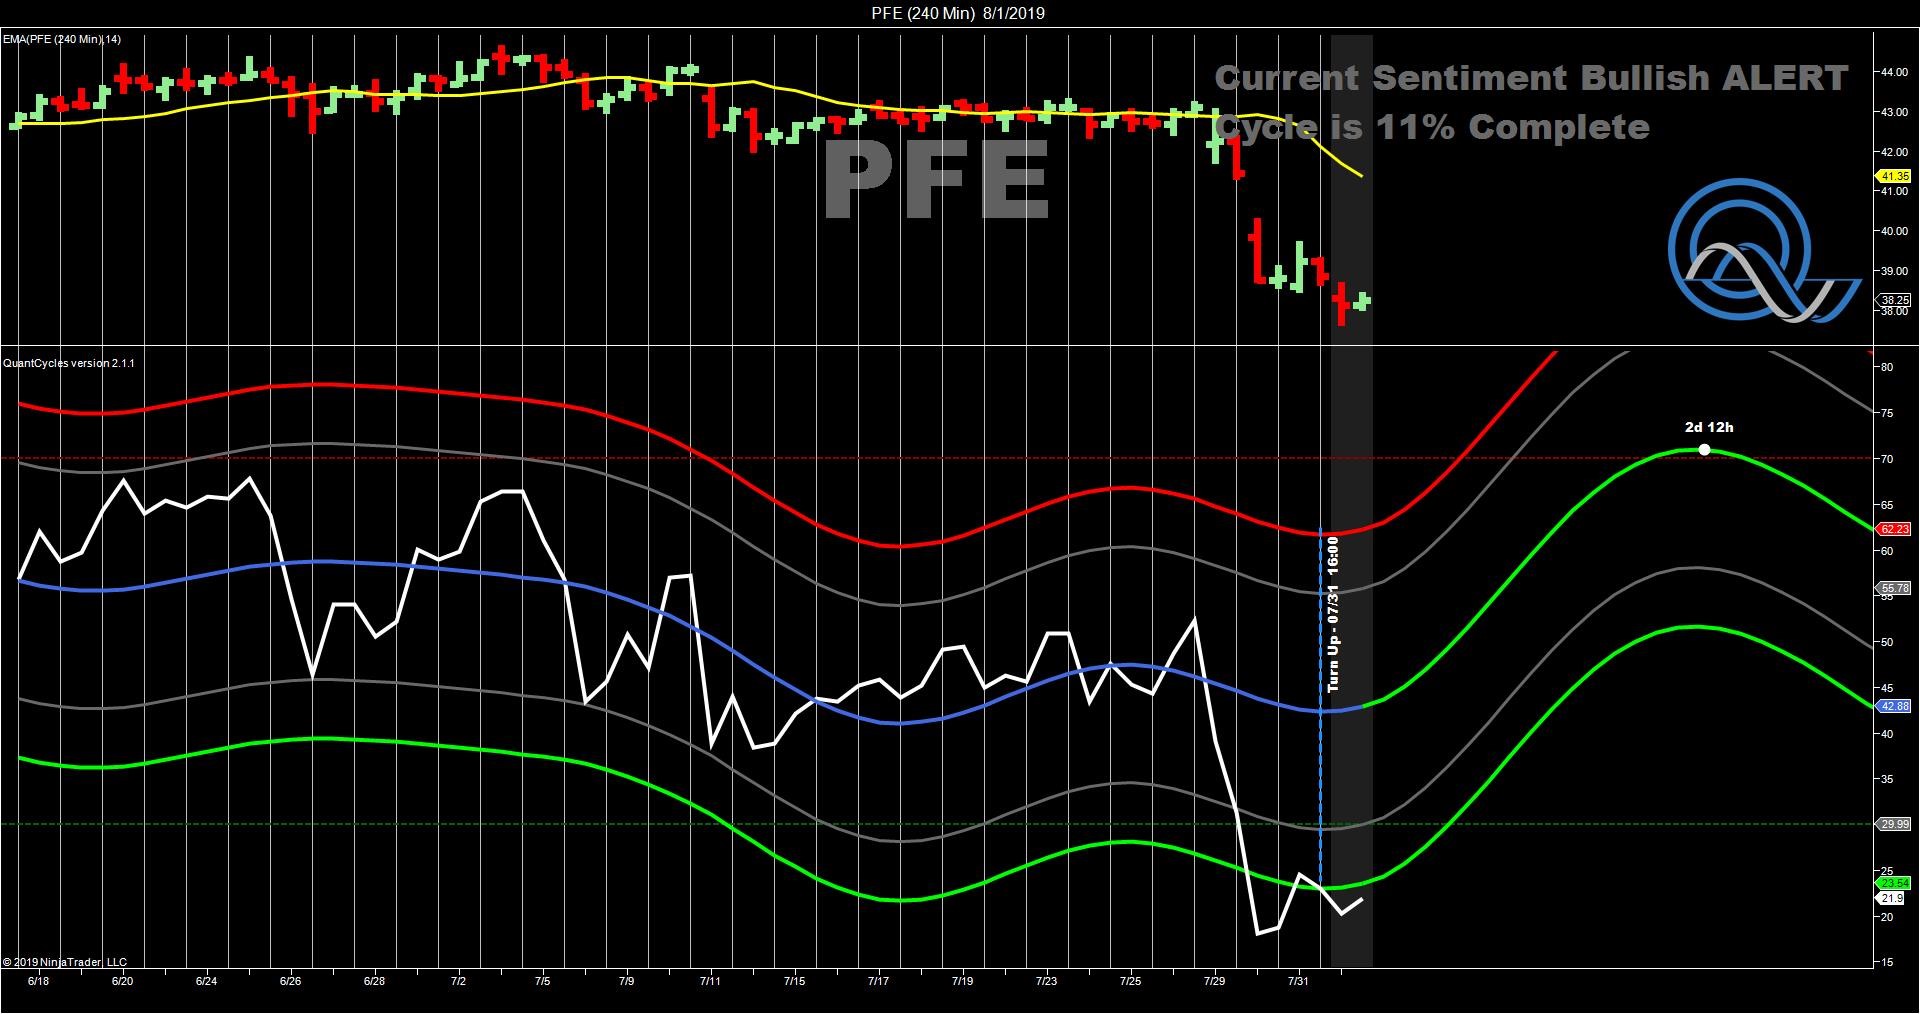
The four-hour chart is also in extreme oversold territory as you would expect, but also made a recent bottom and has turned positive (see chart).

The short-term oscillator suggests that a near-term corrective rebound could be sharp.
While it is hard to measure technical against breaking fundamental news, PFE has recently made 52-week lows and all of the bad news appears to be out, so this could be a strong buying opportunity.
John Rawlins described the value of the QuantCycles Oscillator recently at The Orlando MoneyShow.
The QuantCycles indicator is a technical tool that employs proprietary statistical techniques and complex algorithms to filter multiple cycles from historical data, combines them to obtain cyclical information from price data and then gives a graphical representation of their predictive behavior (center line forecast). Other proprietary frequency techniques are then employed to obtain the cycles embedded in the prices. The upper and lower bands of the oscillator represent a two-standard deviation move from the predictive price band and are indicative of extreme overbought/oversold conditions.


