
The S&P 500 is in the midst of an upsloping wedge correction, but a larger correction may be due, reports Joon Choi.
Two weeks ago I mentioned that it was worrisome that the Cboe Volatility Index (VIX) failed to make lower lows as the S&P 500 Index (SPX) was setting record highs and that equities may have a tough time in the coming months. As the trade war intensifies with China, we are seeing capital exodus from equities into safe-haven assets such as gold and Treasury bonds. In fact, the iShares Core US Aggregate Bond ETF (AGG) and the SPDR Gold ETF (GLD) outperformed the SPDR S&P 500 ETF Trust (SPY) by 6.4% and 16% respectively since May. Furthermore, SPY is down 4.7% since its peak on July 26 and down an additional 1% as I am writing this. There is another bearish formation in the SPX that suggests that we may see further deterioration in equities.
Upsloping wedge
An upsloping wedge formation suggests that the price swing is slowing as prices increase. Upsloping wedges tend to form prior to selloffs. There were three such instances in the past 12 months (see chart below).
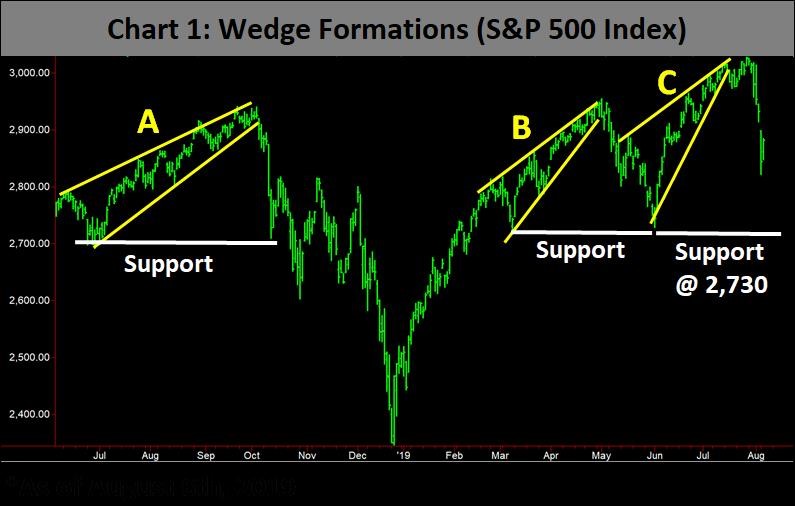
The first upsloping wedge (A) occurred in the third quarter of 2018 and once the uptrend line was broken on Oct 4, a 6% selloff ensued. The decline happened to stop at the level at which the wedge formation started. The next one formed in March-April of this year (point B) and the SPX broke the trendline on May 2, on its way to a 5.7% selloff. Once again, the SPX stopped falling when the index reached the level at which the wedge formation started. The most recent one formed in June-July, the index violated the uptrend on July 17 and it’s down 3.3% so far. If the previous two instances serve as a guide, the SPX should find support at the level where the wedge started (2,730), which is approximately 5% from the Aug. 6 closing level.
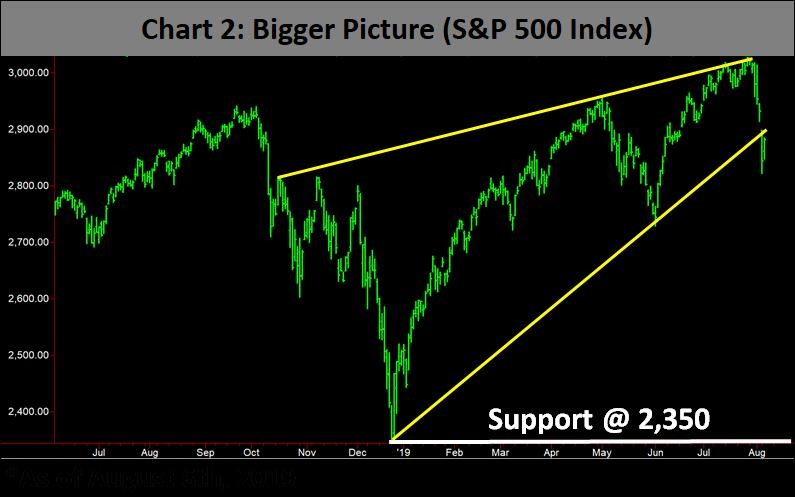
Bigger Picture
Another upsloping wedge formation, but at a much larger scale, can be identified when you take a broader view of the market (see chart below). This formation started at the end of last year and it was intact until Aug. 5 when the SPX broke the trendline. Applying the same technique to forecast a support level, the SPX may find support at 2,350, which is approximately 18% from its current level!
Conclusion
The signs of further equity weakness are mounting as the SPX broke down below the trendline of an upsloping wedge formation in addition to the VIX Index failing to make lower lows as the SPX saw record levels. Moreover, the iShares Transportation Average ETF (IYT) and the small-cap iShares Russell 2000 ETF (IWM) are far below their previous highs, which may be an indication that equities are running out of steam.
Lastly, as we enter the tail end of the summer in August, all our proprietary equity models flashed sells on the first day of the month. We may see rallies from the current level, but they will probably be short lived as the intermediate-term trend may be to the downside. Don’t forget the two support levels for the SPX: 2,730 and 2,350.
You may have missed the lions share of the move towards 2,730, but if that support level is taken out, there could a much larger move lower. Traders may choose to enter a short on a buy stop just below the beginning of the shorter-term wedge.


