
The recent volatility has traders on edge, as they should be, but with rates lower across the board a prudent stock picker can find value, writes Joe Duarte.
In what is becoming an increasingly disorderly world, investors are waiting for the next shoe to drop (or tweet to hit) as they ponder if and when to head for the exits or to once again buy the proverbial dip.
The financial markets ended the week on Aug. 9, 2019 at crucial chart pivot points for the major indexes, bonds, currencies and commodities. A fact which suggests that traders have some big decisions to make. Simultaneously, and complicating the decision-making process for those on the fence, a good number of stocks are on the verge of chart breakouts.
Thus in the current world where a tweet can launch a million algorithm trading programs and create massive gains or losses in seconds, getting ready for a potentially wild ride while picking the best possible stocks to own and managing them properly, regardless of the plausibility of the task, is the key to success.
Big Week Ahead for Bonds and MEL
The dance between the Federal Reserve, the bond market, and the Markets-Economy-Complex (MEL) could take an interesting turn this week. With three central banks (New Zealand, Thailand, and India) lowering interest rates last week and a huge increase in mortgage refinancing in the U.S. following the Fed’s recent rate cut, it’s clear that the general public is very aware of the trend in interest rates and is acting accordingly.
Due to cell phones, social media and the 24-hour news cycle, markets and life are more interconnected than ever and the reaction times to events by all participants in MEL have been cut dramatically. In turn, this real time awareness of events, the market’s response and the ensuing chain reaction, prods people to make financial decisions, which then feedback into the economy and back to the markets either perpetuating the cycle or causing significant shifts in MEL in a fraction of the time compared to past cycles.
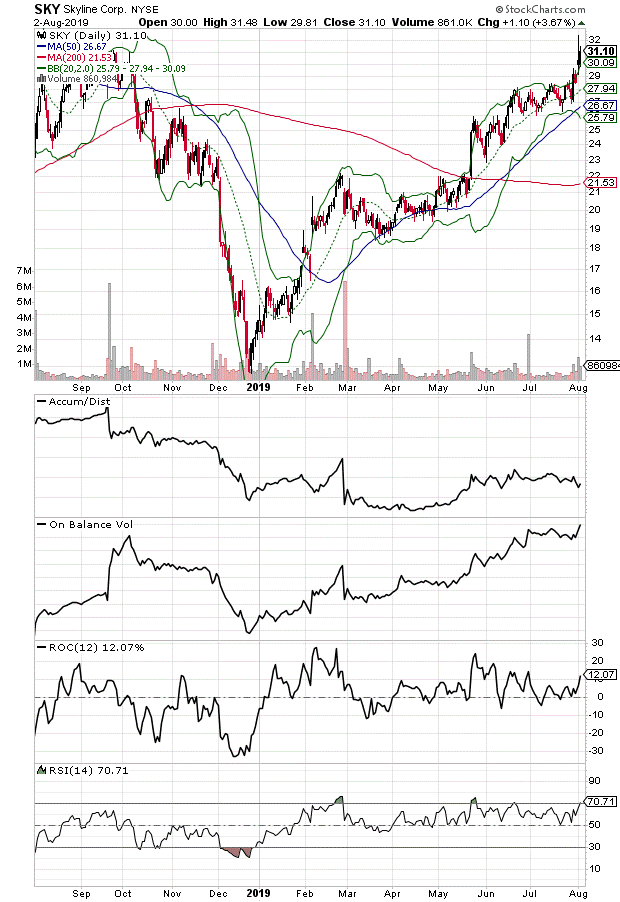
For example, since the Fed and other global central banks have been lowering interest rates, we have seen bond yields fall rapidly while the stock market has been on a very bumpy ride. At the same time, we have seen a rapid increase in mortgage refinancing. What we have not seen, yet, is a major spike in housing purchases other than in earnings reports for companies such as Skyline (SKY), which makes lower priced and more affordable mobile homes that we featured last week. That means that if we are going to get a big move up in housing activity beyond mortgage refinancing we should start to see it in the weekly mortgage data over the next three to four weeks (see chart).
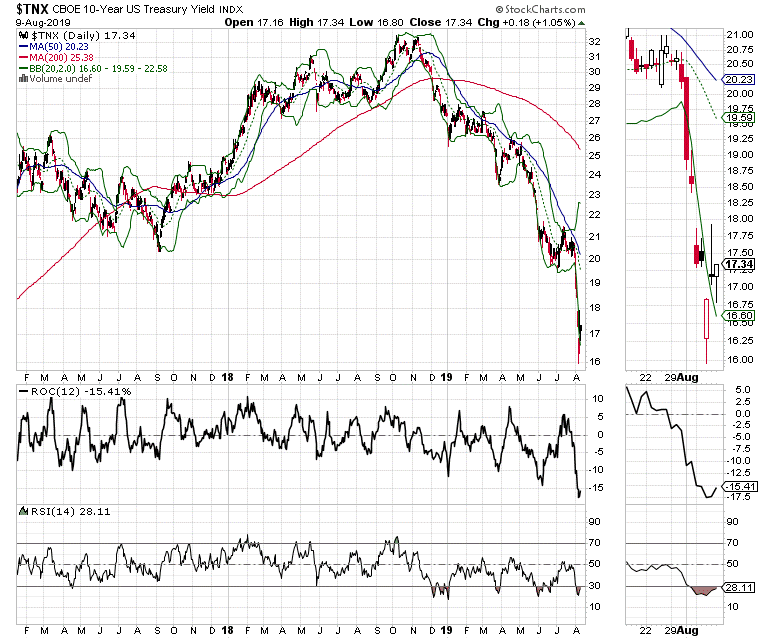
Meanwhile, the U.S. Ten Year Note yield (TNX) is working out a new trading range with 1-60-1.65% as the current bottom and 1.80% or so as the top (see chart). Any break above or below these key levels will likely mean that something extraordinary has happened and that things will ripple through the MEL system.
And although there has been no official data yet as to whether home buyers are coming off the fence in response to the fall in mortgage rates, the S&P Homebuilders Index as represented by the Invesco S&P 500 High Beta ETF (SPHB) is tracing out a very bullish chart pattern which suggests that the market is starting to bet on such a development (see chart).
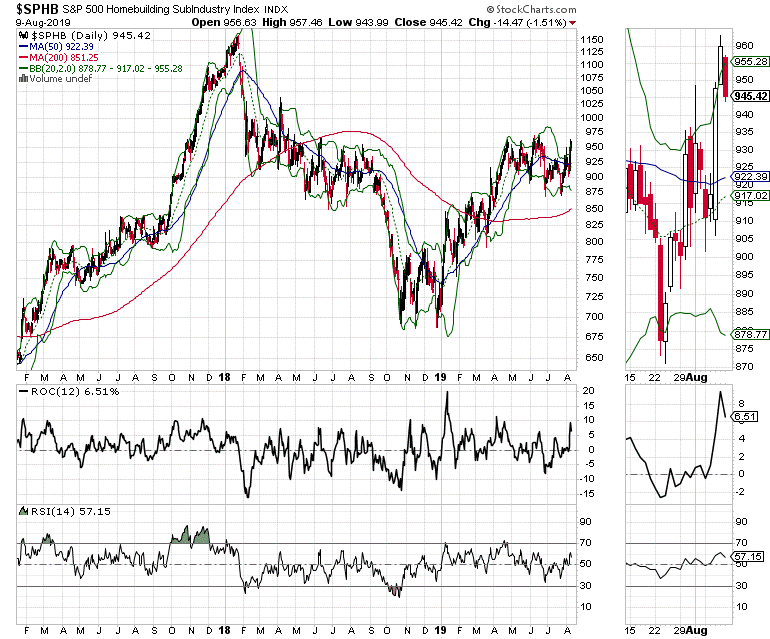
If we see increasing strength in housing, and a breakout in SPHB, we can expect a whole new cascade of interconnected developments to ripple through MEL, which could lead to even more interesting events and changes in behavior from central banks.
A Dramatic Turnaround Story
It’s not always easy to find big winners in any single sector, much less in the current market. Yet, Astra Zeneca (AZN), an old school pharmaceutical stock which has nowhere near the name recognition of some of its grossly underperforming peers, think Pfizer (PFE), has been slowly building quite a cancer pipeline under the radar, especially in the area of difficult to treat advanced lung and prostate cancers. Moreover, the cancer drugs are starting to pay off, both in patient results, and on AZN’s top and bottom lines (see chart).
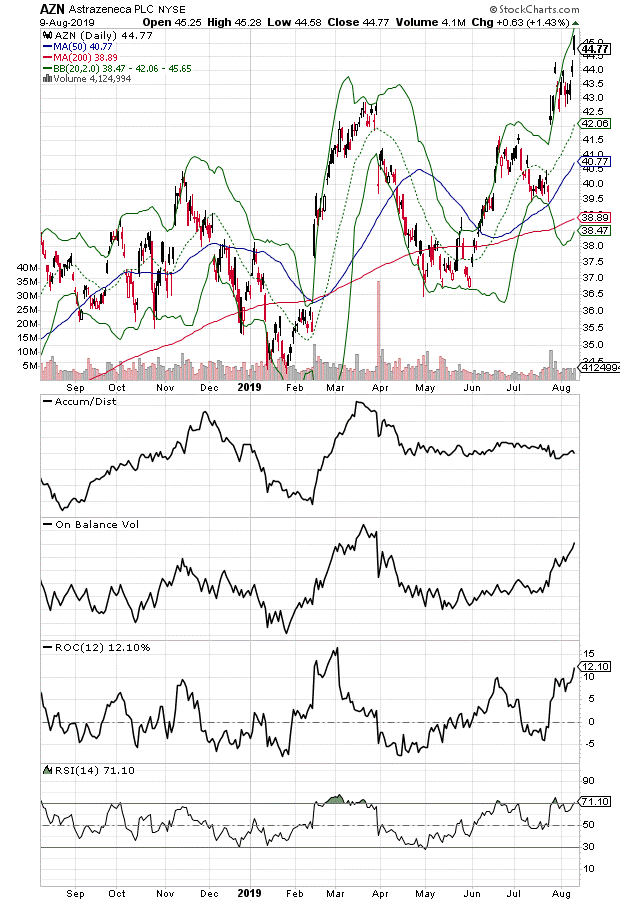
In fact, AZN recently announced significant successes in late stage clinical trials for Tagrisso in lung cancer and Lynparza in late stage prostate cancer, which led to a chart breakout for the stock. If these trials lead to FDA approvals, they will likely increase AZN’s already growing marketplace footprint for its oncology division which had $4 billion worth of sales in the first half of the company’s current fiscal year.
Meanwhile, the company is expecting big things, having signaled very positive guidance numbers for the second half of the year, powered by its new medicines along with rising pipeline expectations. Indeed, AZN, who’s most recent glory days were in the 1980s and 1990s has been stealthily transforming into a biotech cancer powerhouse, while improving on its diabetes and cardiovascular franchises.
Furthermore, aside from a very positive and evolving story plus a great price chart, the technicals for the stock are very encouraging, as AZN is nearing a breakout of its On Balance Volume (OBV) just as its Accumulation Distribution Index (ADI) is starting to turn up. These are both signs that money is moving into the shares. Moreover, if the stock can stay above $43 it has the potential to move the mid$50 range over the next six months, barring a general market meltdown. Finally, AZN just declared a $0.90 per share dividend for holders of record on Aug. 9.
NYAD is still in Recovery Mode
The New York Stock Exchange Advance Decline line (NYAD) has been the most accurate indicator of the stock market’s general trend since the presidential election of 2016, which is why its current posture suggests that caution is still warranted.
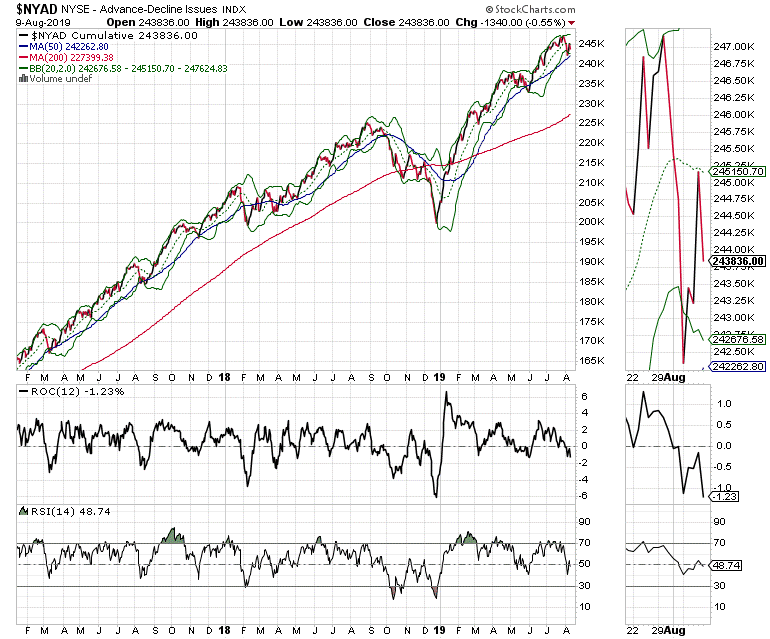
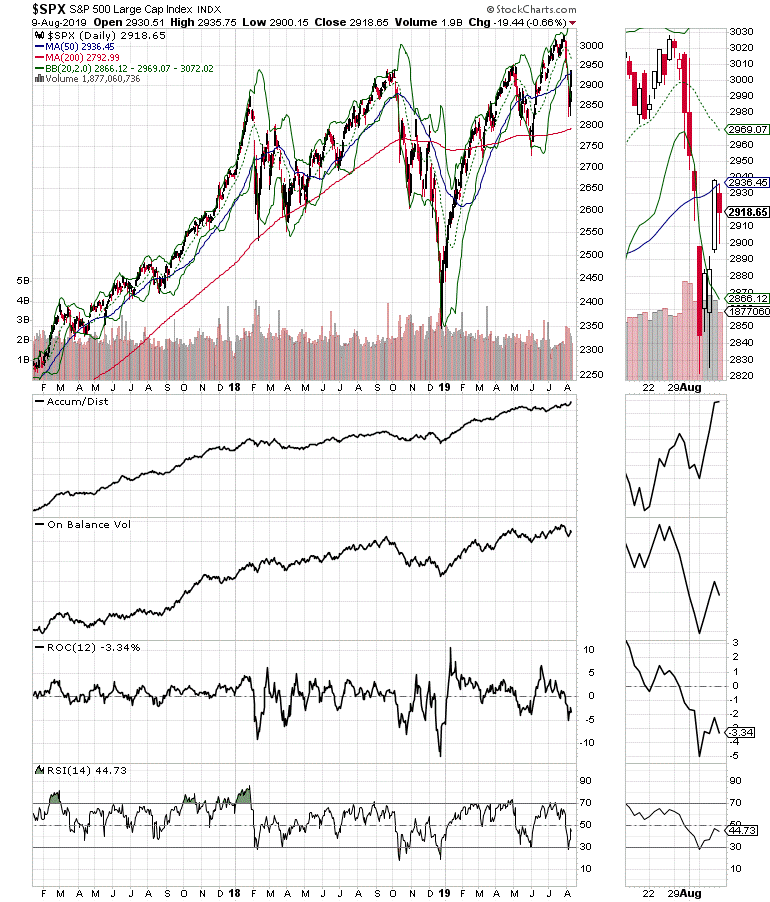
The big and very worrisome technical development is that the NYAD, the S&P 500 (SPX) and the Nasdaq 100 (NDX) indexes are all in similar postures to where they were before the October 2018 bear raid.
Certainly NYAD may be in the early stages of what could be an intermediate term bottoming process, but until it can stay above its 20-day moving average and eventually make a new high, its actions are cautionary.
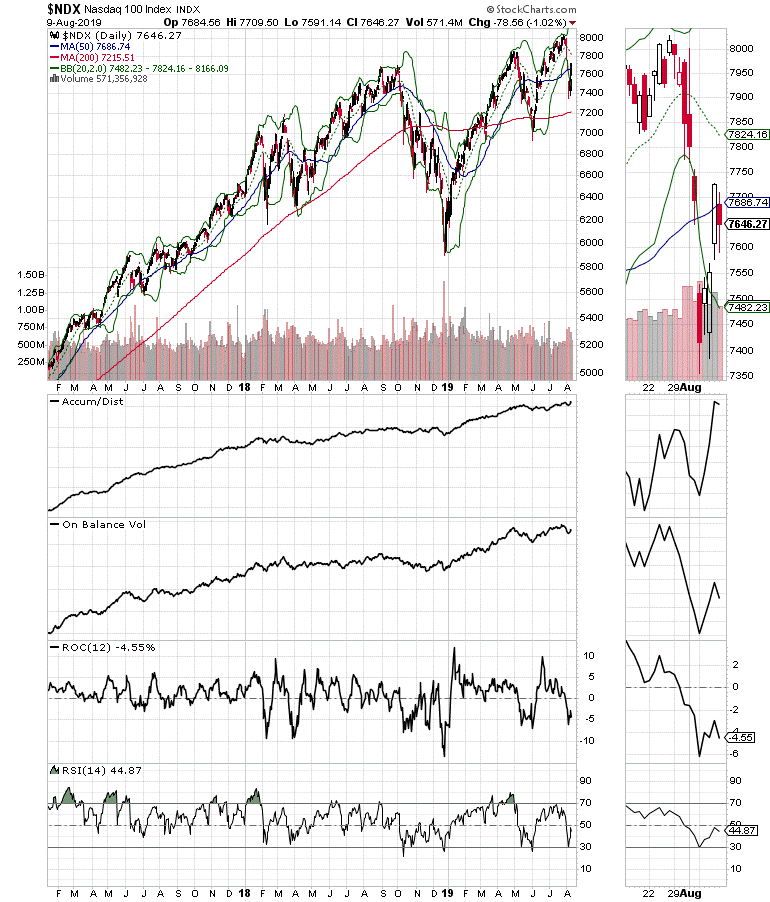
Nevertheless, the market has not sounded the all clear, as the S&P 500 (SPX) and the Nasdaq 100 (NDX) indexes both failed to close the week above their 50-day moving averages, which means that any further weakness could lead to a break of recent support and perhaps a new and more aggressive down leg.
Alertness & Selectivity
When markets move hundreds of points in response to a tweet by President Trump or anyone else, it’s a signal that traders are on edge and that risk is higher than normal. Paradoxically, given the fact that global central banks are now on a lower rate trajectory, it’s also not a good idea to give up on stocks altogether.
The bullish side of things is that although the pickings are not as plentiful as they were in December and January, there are still areas of the market where choosy investors could find places to put their money, at least for now.
So, if you stay alert, patient, and hedge your bets while being precise and selective in what you own, you are more likely to pick winners in this market, unless the whole thing breaks down as it well could if the technicals don’t improve quickly.
I own SKY
Joe Duarte has been an active trader and widely recognized stock market analyst since 1987. He is author of Trading Options for Dummies, and The Everything Guide to Investing in your 20s & 30s at Amazon. To receive Joe’s exclusive stock, option, and ETF recommendations, in your mailbox every week visit here.


