
Here are more chart patterns in Dow component companies from Suri Duddella.
Yesterday we discussed the performance of the Dow Jones Industrial Average and its components, including a bullish Symmetrical Triangle and ABC pattern in Apple (AAPL).
Here are some additional chart patterns that still has some legs to them.
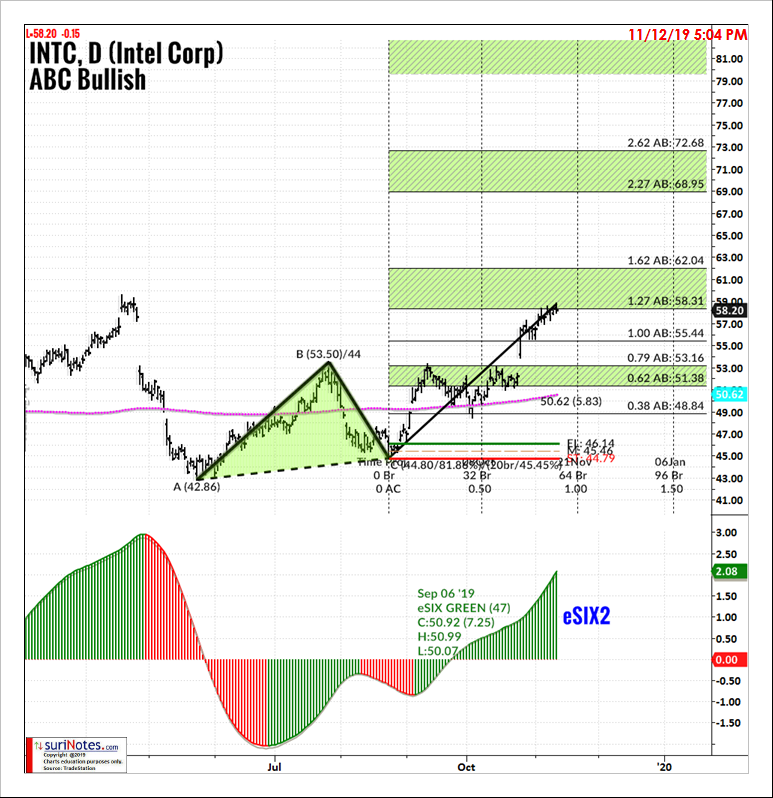
Intel corp. (INTC) also performed well in 2019 and has formed an ABC Bullish pattern between May 2019 and July 2019. INTC ABC Bullish pattern long entry was above $46 with first target range $51-$53 and second target range $58-$62. Similar to APPL, if INTC continues its bullish trend in 2020, it could reach its third target range of $69-$72 (see chart).
Rectangle Channel Pattern
Rectangle Channel patterns are formed by price action between two key trendlines bound by multiple equal (near) highs and lows. The duration of the pattern can be few days to months. Longer duration patterns are more reliable.
The pattern must have at least two pivots (equal highs or equal lows) on each of the trendlines. The price breakout can occur in any direction from the pattern, but the general belief is price may breakout in the same direction as prior direction before the pattern formation. The volume inside the pattern is non-decisive, but volume tends to increase during the breakouts.
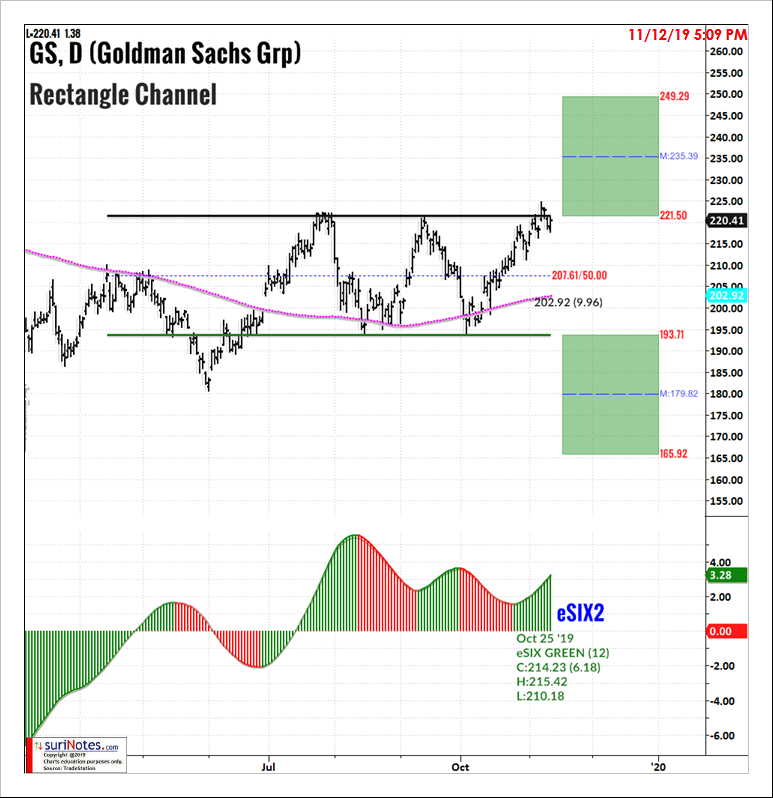
Goldman Sachs (GS) formed a rectangle channel from May 2019 until Nov. 2019 between $193-$221.5. In November 2019, it closed above $221.5 to signal a breakout. The upper target range for the Rectangle pattern are $235-$249 (see chart).
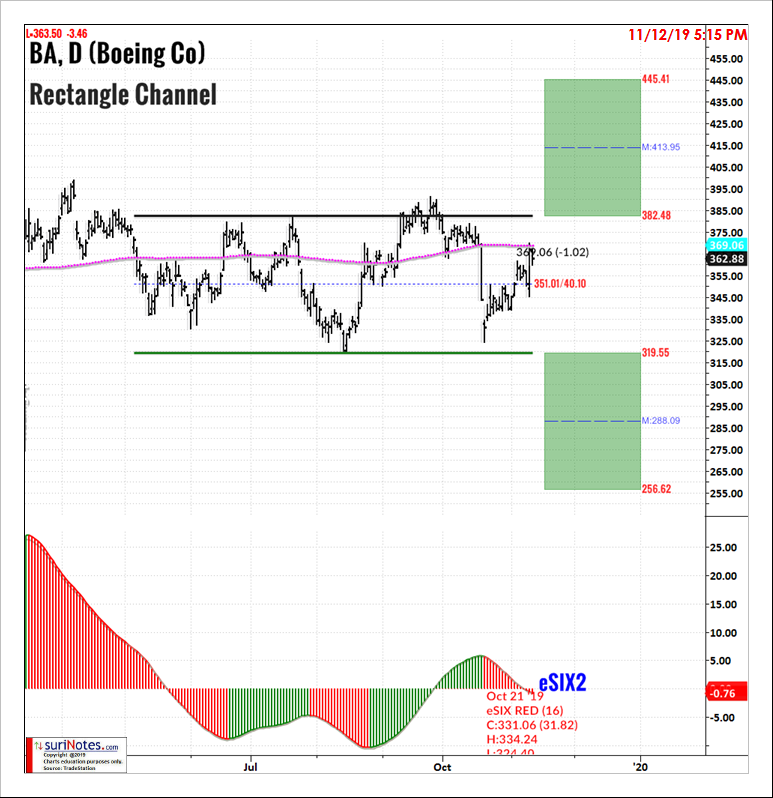
Boeing Corp. (BA) is also trading in a Rectangle Channel Pattern. Boeing has been trading sideways for the most of 2019 after 737 Max problems. BA formed a rectangle channel pattern between $319-$382. If price closes above the upper trendline ($382), BA upside targets are set $413-$445.
Find more of Suri’s work at surinotes.com.


