
The Dow Jones Index has performed well in 2019 and several components are in the midst of interesting and profitable chart patterns, writes Suri Duddella.
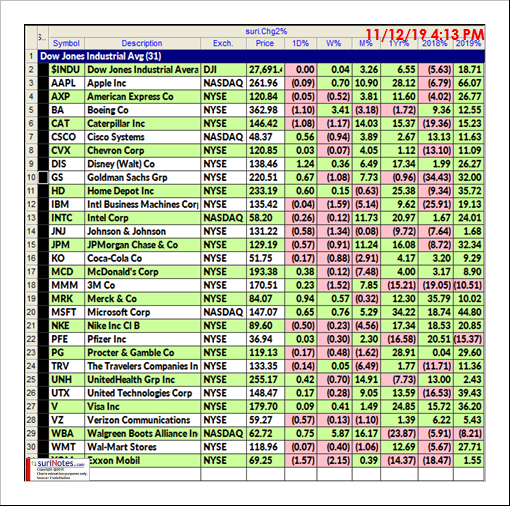
The Dow Jones Industrial Average is a stock market index that measures the stock performance of 30 large companies listed on U.S. stock exchanges. More than 50% of Dow stocks were in the red in 2018 as the index under-performed the broad markets. So far, Dow components as the overall index have done extremely well in 2019 though the index has kept up with the other major indexes. The Dow is up 18.71% year-to-date, lagging the S&P 500 Index (23.24%) and Nasdaq Composite Index (27.89%) for the year.
The top three best performers in the Dow are Apple (AAPL), up 66.07%, Microsoft (MSFT) up 44.80% and United Technologies Corp. (UTX) up 39.43%. The under performers and only components in negative territory are Walgreens (WBA), down 8.21%, 3M (MMM) down 10.51% and Pfizer Inc. (PFE) down 15.37% for 2019 (see table of Dow Stocks Performance Comparison for the Year 2018 to Year 2019)
Many Dow components are exhibiting interesting and exploitable chart patterns.
Symmetric Triangle Patterns
AAPL: Apple has significantly outperformed the Dow stocks in 2019 as it posts 66.07% gains year-to-date. In 2019, AAPL has two significant bullish chart patterns: An ABC Bullish pattern and Symmetric Triangle pattern.
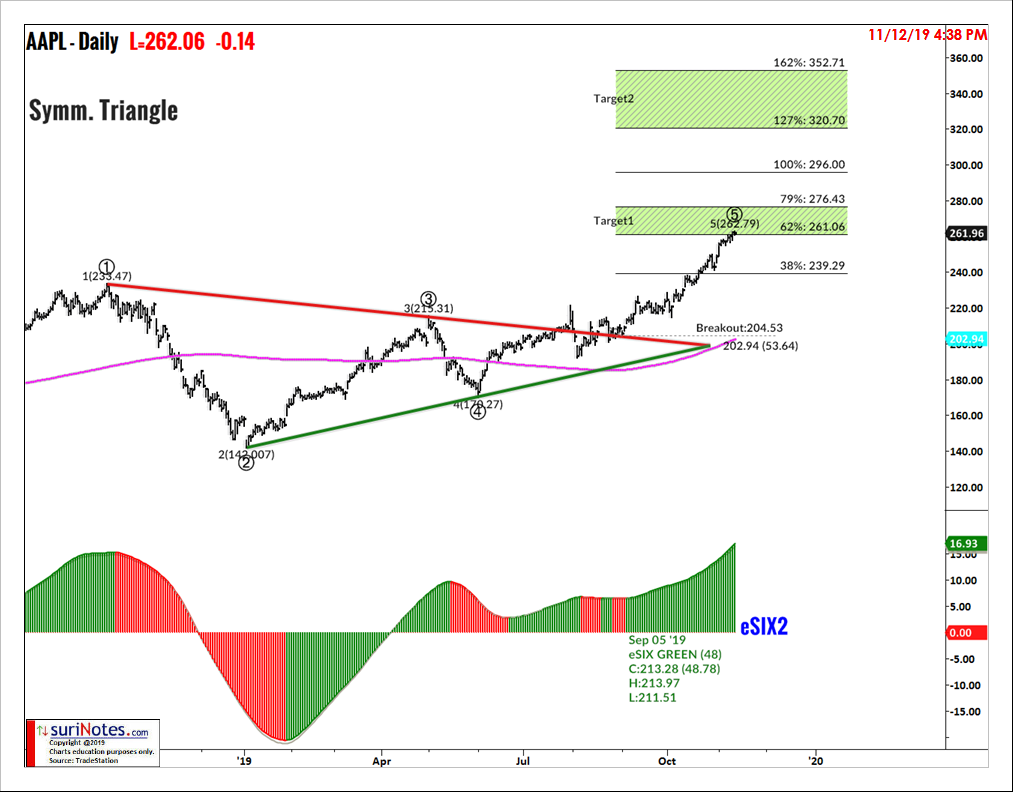
Symmetric Triangles can be characterized as areas of indecision. Market price-action pauses during these indecision periods as prices trade in a consolidation phase. Volume tends to be diminished during consolidation phases. Eventually, a resolve (breakout or breakdown) from the upper or lower trend lines will result, and prices will explode out the triangles.
Usually, triangles break in the direction of its prior trend, hence signifying its Continuation Pattern status. However, in many cases triangles produce a reversal pattern after its initial breakout in the opposite direction, giving the trader the opportunity to trade the opposite of the pattern.
Since October 2018, Apple’s daily chart has formed a Symmetric Triangle pattern as it made a series of lower highs and higher low pivots. AAPL's Symmetric Triangle breakout level is at $205.79. A Long trade is entered above the breakout price with a stop below the recent pivot low of $192. The first target is set at $240.5, and the next target is $262 followed by targets of $296, $320-352 (see chart).
ABC Bullish Pattern
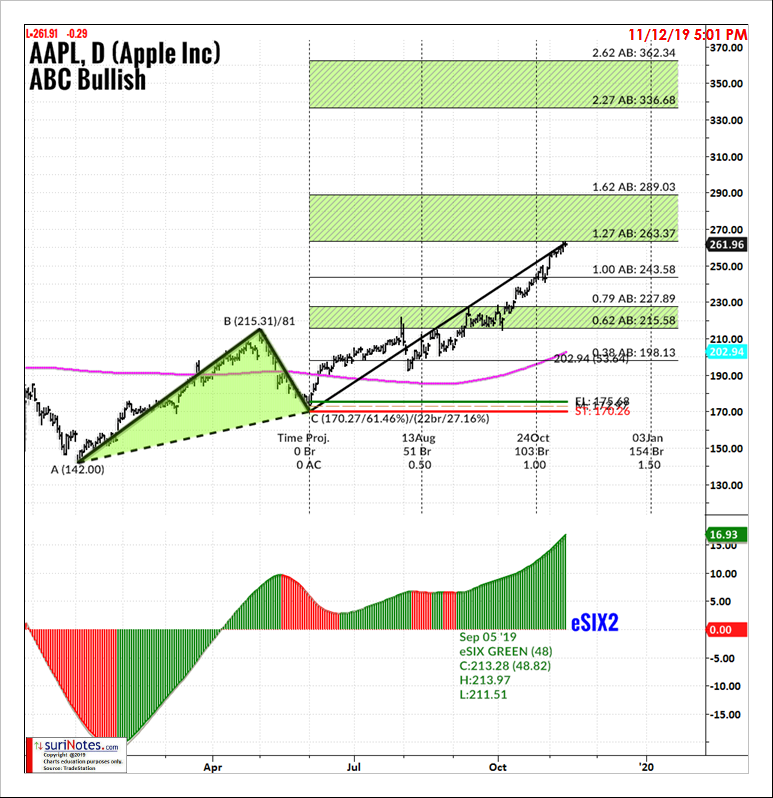
The ABC Chart pattern and its related AB=CD Chart Pattern are prime examples of "Symmetry" in the markets. These "Harmonic" patterns help traders to identify buying and selling opportunities in all markets and in all timeframes. The ABC and AB=CD patterns are first described by H.M. Gartley in his book "Profits in the Stock Market.” The main advantages of trading harmonic patterns are that they allow traders to determine risk vs. reward ratios beforehand as they forecast key market turning points and profit targets for traders. The ABC pattern (can be a continuous or reversal pattern) and it is shaped like a lightning bolt.
AAPL also formed an ABC Bullish pattern from January 2019 to June 2019 between $142 and $215. The ABC Pattern long entry was above $175 with an initial stop at $170. The first target zone ($215-$227) was reached in July and price is currently nearing the second target zone. If AAPL continues its bullish trend it could see the third target zone, $336-$362 (see chart).
Tomorrow we will discuss ongoing chart patterns in Dow components.
Find more of Suri’s work at surinotes.com.


