
Several stocks in the pharmaceutical and biotech subsectors are exhibiting exploitable patterns, reports Suri Duddella.
The pharmaceutical business sub-sector is categorized under the larger healthcare sector. Companies in the pharmaceutical sub-sector derive their business by researching, discovering, developing, manufacturing, and marketing pharmaceutical medicines and drugs.
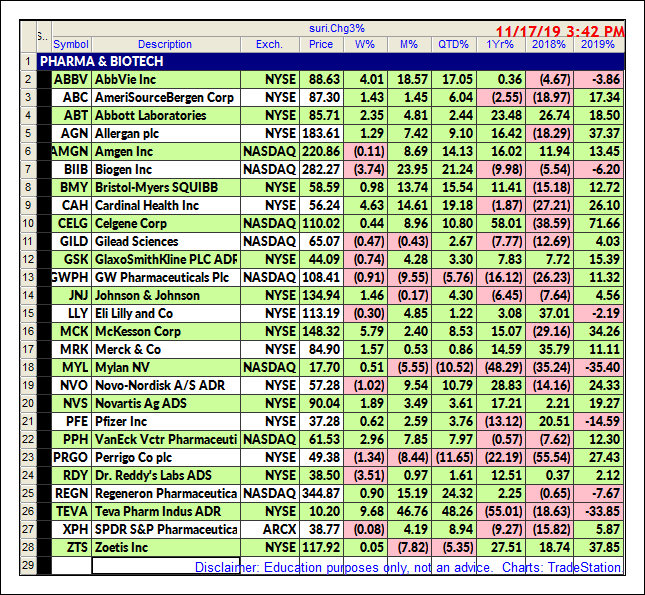
The pharmaceutical & biotech sectors had lackluster performance in 2018. In 2019 and in the last quarter of 2019, most of these stocks seen better performances (see table below). This may be suggesting the pharma & biotech sectors may continue performances in 2020 as they breakout of consolidation ranges.
This quarter's best performers are: Teva Pharmaceutical Industries Ltd. (TEVA) up 48.26%, Biogen Inc. (BIIB) up 21.24%, Cardinal Health Inc. (CAH), up 19.18% and Amgen Inc. (AMGN) up 14.13%. Some of the Big Pharma stocks are still basing in consolidation patterns and if the current quarter trend continues, they may see breakouts to the upside in 2020.
Trading Rectangle Channels
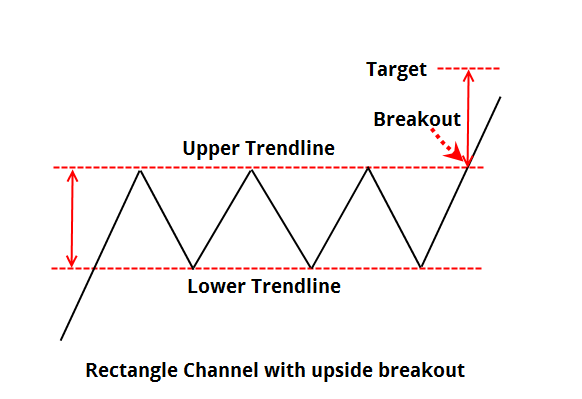
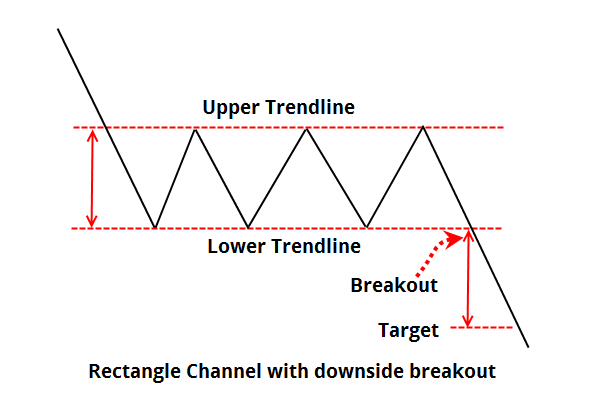
Rectangle Channel patterns are formed by price action between two key trendlines bound by multiple equal (near) highs and lows. The duration of the pattern can be few days to months. Longer duration patterns are considered to be more reliable. The pattern must have at least two pivots (equal highs or equal lows) on each of the trendlines.
The price breakout can occur in any direction from the pattern, but the general belief is price may breakout in the same direction as prior direction before the pattern formation. The volume inside the pattern is non-decisive, but volume tends to increase during the breakouts (see diagrams below).
Rectangle Patterns in Pharmaceutical stocks
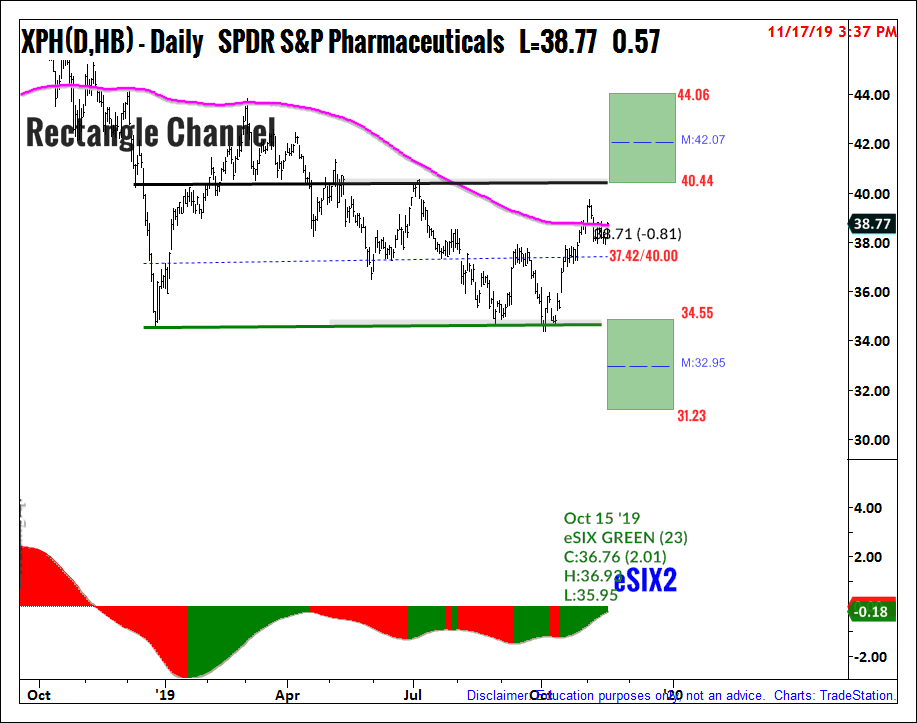
Last week we shared some Rectangle patterns in Dow Jones Index components, here we focus on pharma stocks. The SPDR S&P Pharmaceuticals ETF (XPH) is trading in a rectangle chart pattern between $34 to $40 in 2019. In the last quarter of 2019, XPH posted gains of 8.94% showing a potential uptrend from its consolidation range (see chart below). If XPH closes above $40.45 (and the 200-week simple moving average), it would signal a long entry. The XPH upside targets are near $44.
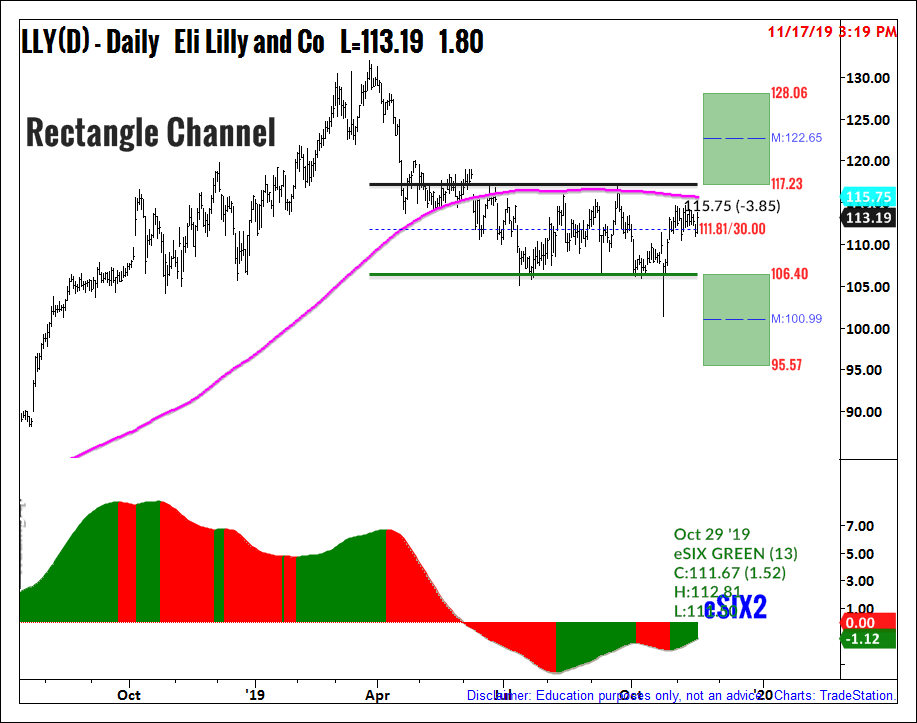
Eli Lilly's (LLY) daily chart is trading in a rectangle chart pattern since April 2019 between the ranges of $106 to $117. If LLY closes above the 200-week simple moving average and above the upper trend line near $117.23, buy LLY with an upside price target zone is $122-$128.
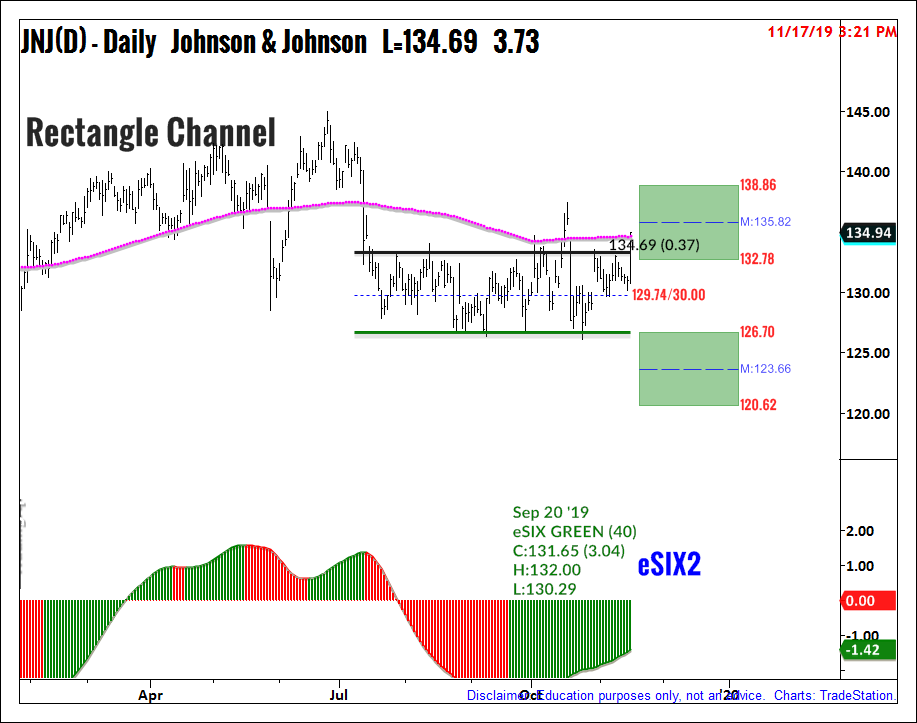
Johnson & Johnson (JNJ) also is trading in a Rectangle Channel. JNJ is trading in a consolidation range between $126 and $132 from July 2019 until now. If JNJ closes above the upper trendline at $133, it may signal as a breakout. The upside targets are $135 and $138.
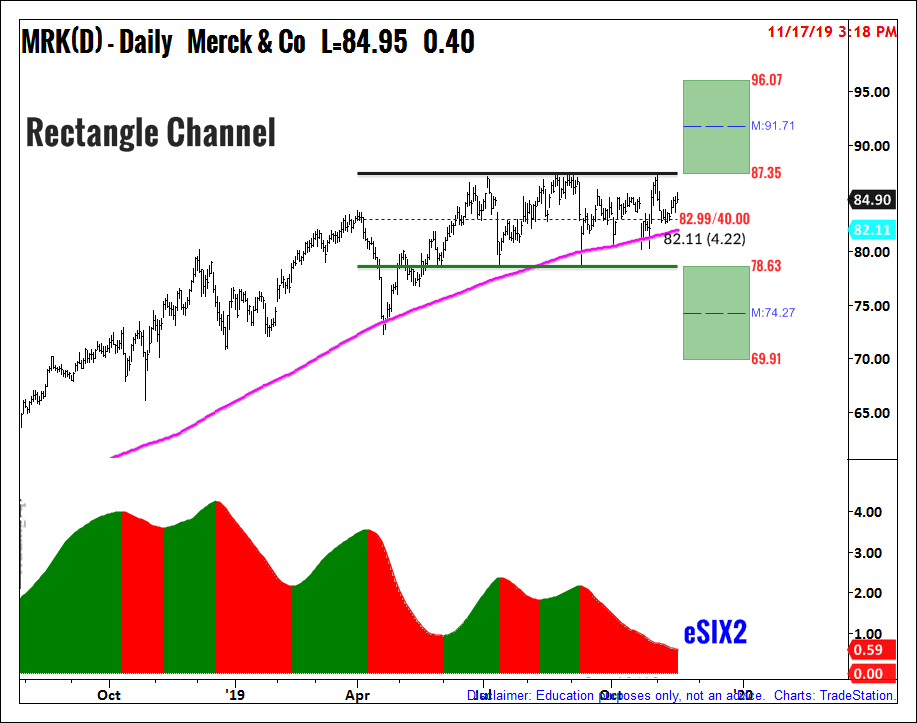
Merck & Co. (MRK) in its daily chart is also trading in a consolidation rectangle Channel pattern between the price range of $78 and $87 from April 2019 until now (see chart below). If price closes above the upper trendline at $87.36, the upside targets are set at $91 and $96.
Find more of Suri’s work at surinotes.com.


