
Many of you are familiar with the Gann square of 9, here we dig a little deeper in the work of W.D. Gann, writes Jeff Greenblatt.
Many of you are familiar with the Gann square of 9. In his infinite wisdom, W.D. Gann came up with a formula to take the price movement from point a to point b and converted it to degrees in a circle. We call that movement the range. So, a range of 20 points in a stock could correspond to 45 degrees if it were converted to a circle. In case you don’t know that formula is to subtract the square root of the low from the square root of the high to get a difference called a factor. We then take that factor and multiply by 180 degrees. In Gann’s world everything is made up of angles and degrees in a circle. There is a clock for every trading day and a larger clock for the entire year. Each day of the year has a different vibration and it contributes to why certain numbers show up on charts at different times of the year.
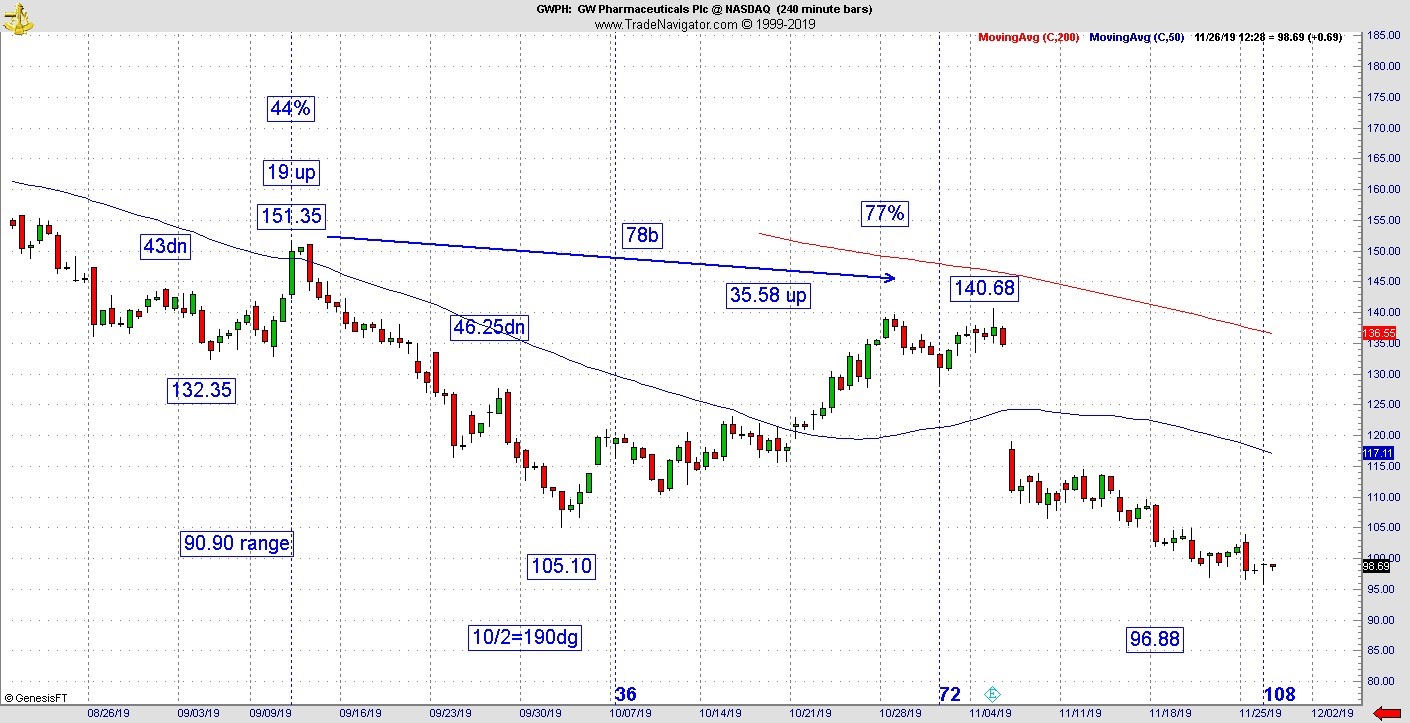
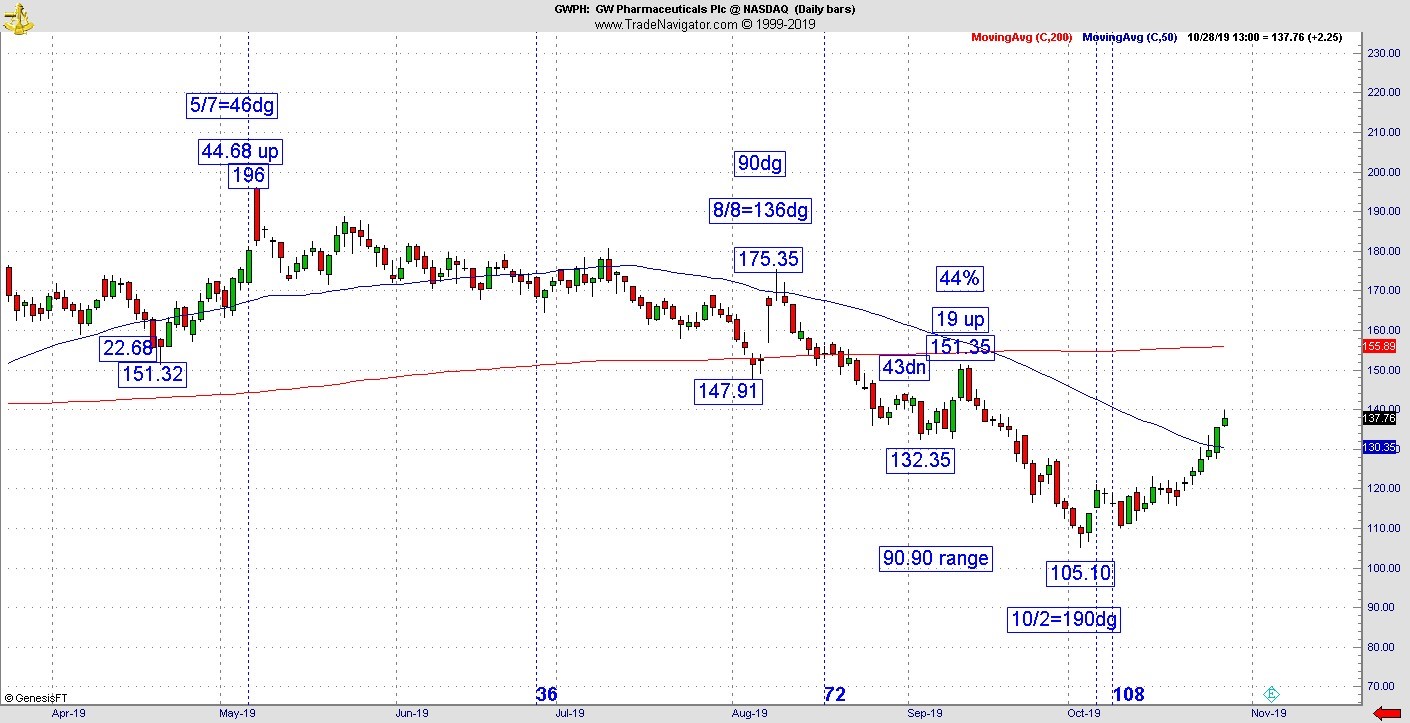
Here's an example. Take pharma firm GW Pharmaceuticals PLC (GWPH), for instance. From May until October there was a massive drop.
The range was $90.90 to the October low. That low on Oct. 2 vibrated on the calendar at 190dg. See the vibration on the chart below? It wasn’t a long-term bottom but it was a 35 point move which turned out to be a 77% retracement against the prior bounce high. How do you recognize that high? That 77% retracement was 78 bars on a 240-minute chart which is part of our Kairos methodology. The Gann calendar is not new, I didn’t invent it. One-way traders figure it out is to obtain his master courses and piece together the wheel around square of 9 as well as taking into consideration the important numbers and angle points, he believed were most important. Some trading software companies provide a version of it.
I’ve read he never gave a ‘formal’ teaching on this subject. Rather he left it to us to come up with the proper daily vibrations. We’ve spent many years in this space working with the trading daytime windows but the Gann calendar tends to work when the trading windows do not. Its only recently that I started putting together this revelation.
Speaking of trading windows, the stock market is right at 233 days from the beginning of this rally that started the day after Christmas. Last week the E-mini was at 233 days and it hit early due to the fact futures markets will be open for several hours on a holiday yet it gets counted as a full trading day. The market recovered from last week’s weak selling. Now we enter the Thanksgiving phase which is really the start of the Santa season. From now to the end of the year it will be hard for bears to feed well. The best they may get is a turkey sandwich.
In the period from Thanksgiving through the end of the year markets can have smaller selling waves but they generally recover. Markets can even peak in December yet we don’t recognize it without the benefit of looking in the rear-view mirror. What that means is if we hit a high in the middle of the month, it might be January before we realize that was top. Last year the bottom hit right at Christmas and we didn’t realize it until well into January. Overall, markets look very decent. Tech stocks like DSP Group Inc. (DSPG) and Diodes Inc. (DIOD) bounced in the exact right place and got some follow through in the past couple of days. Oil is also lining up well and surviving a test of first resistance.
What hasn’t been doing so well is precious metals which is losing out to Fed Chair Jay Powell’s stimulated economy. Had the Fed not acted in September when the overnight rate hit 10% there may very well have been a panic if one or more banks couldn’t open for business the next morning. Since then the market has hardly missed a beat. Precious metals have been down since early September and especially when the secondary high formed on Sept. 24.
Summing it all up, the pullback remains elusive. What began last week barely got out of the starting gates. Right now, at the current 233-day window, this may be the very last chance for bears to do anything for 2019. Even if they do, its not likely to amount to much. As far as larger time cycles are concerned, realize the Gann calendar starts and ends at the March Spring Equinox which also happens to be one of the four seasonal change points for all financial markets in the year.
If you want more information, go to: Lucaswaveinternational.com and sign up for the free newsletter.


