
A recap of the decade in financial markets and a forward look to where markets are headed, by Jeff Greenblatt.
It has been a transitional decade post financial crash. In terms of politics, the world is still trying to figure out what it wants to be when it grows up. When it comes to financial markets, the undeniable theme has been Quantitative Easing (QE) induced easy money for most of the decade. Personally, it was a transition from a pure Fibonacci based methodology to a Kairos based price and time square method.
The two first crossed paths early in the decade. After the initial short covering rally off the bottom, markets leveled off in 2010 but the Dow Jones Index took off for good around Labor Day 2010 when it put in a secondary low at 77 weeks off a bear market that had a 7729-point range to the downside (see chart).
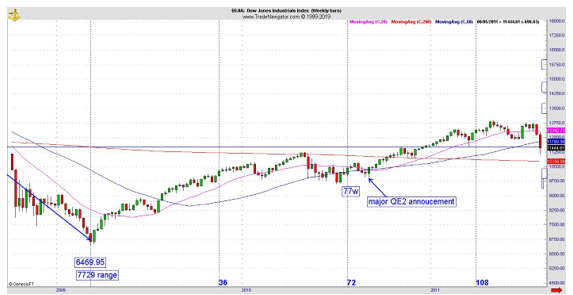
Most people didn’t know, but it was the fall of 2010 when Federal Reserve Chair Ben Bernanke announced an important QE2 program. When the cycle point matures, the news event materializes, almost by magic.
Not many realized at the time that by the end of the decade, the Fed would still have to inject money into the system. They just don’t call it QE anymore.
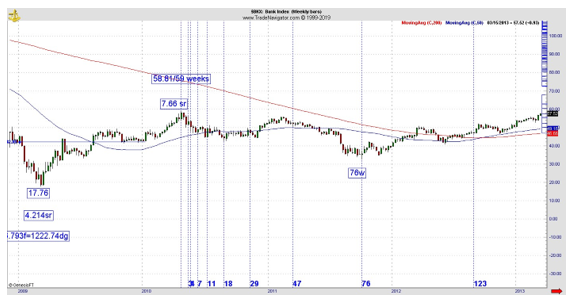
Not long before Bernanke announced QE2, the KBW Bank Index (BKX) had peaked on its first leg off the bottom in April 2010. My first exposure to price and time square outs was a high at 58.81 in 59 weeks. It was very significant because banks had led to the upside out of the crisis and because it reacted to a perfect square out, the overall market was due to correct and this was the power of leverage.
One key reading was the ‘tell’ to an entire market changing direction. As it turned out, the banks didn’t bottom even as the Dow did. The BKX didn’t find it’s retest of the financial crisis until the end of the 2011 correction. This was also a significant Kairos development because it was 76 weeks down from a high that had a square root of 7.66. The square root of the high at 58.81 was a likely vibrational square out of a financial crisis bottom of 17.76 (see chart below). Unfortunately, it took another four years to figure out just how significant price and time influences financial markets.
In any event, the easy money policies kept flowing. There were corrections in 2011, 2015 and 2018 yet no real bear market developed. In 2016 President Trump was elected and a rally ensued that bore his name. The rally continues to this day. But it's hard to say its organic. The early phase of it likely was but in September the repo market jammed up and overnight rates hit 10%. A panic would’ve ensued had the Fed not stepped in. By January they very likely will have injected more than $5 trillion into the system to keep it lubricated. A lot of smart traders were looking for the markets to peak in September, but if you’ve ever read “The Dollar Crisis” by Richard Duncan you know governments have the uncanny ability to postpone the day or reckoning for months if not years.
Over Christmas week, markets likely saw their first real bout of euphoria. The CNBC website showed a picture of a floor trader smiling as Amazon just put on record holiday sales. There are only two iron laws in life. There’s no crying in baseball (Tom Hanks) and there’s no such thing as happiness in the stock market. Want to be happy? Take your profits all the way to the bank.
While traders were celebrating (whoever showed up), the US Dollar got hit very hard. You can see from the chart (below) that Kairos replication is the main technical reason for it. On the prior leg up, it had a range of 1.61, the leg just completed was a 63% retracement. This is a Kairos concept of squaring out called replication.
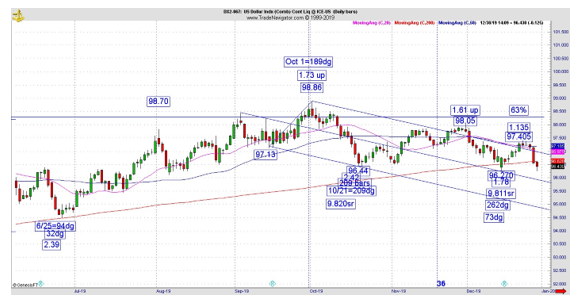
We see similar numbers vibrate over and over. But each new time they manifest slightly different. The only saving grace here is it could be holiday trade. But this is the second time in less than three weeks it has violated the 200-day moving average and it didn’t do that a single time in 2019. In fact, it hasn’t been below the 200-day moving average since April 2018.
If you start connecting the dots, you’ll see a flood of paper into the system has the potential to create a serious collapse of the Greenback in the next couple of years. It is a possible recipe for a hyperinflationary depression. No need to worry about this immediately as the Fed will do everything it can to keep markets elevated through the election next year. But beyond that, longer term cycles call for a hard low by 2022.
What is likely to happen in the first year of the new decade?
Lower bond prices calling for higher rates, a better precious metals market which is finally waking up from its decade long slumber and a continuing weakening of the U.S. Dollar Index. None of this will happen overnight, but these are longer term views which manifest by 2020 or 2021the latest.
The biggest problem going forward is the Fed will be hard pressed to ever get off the QE bandwagon. Imagine what will happen to the market if the money supply starts to shrink again? We got a taste of it in the fourth quarter of 2018.
In the near term, by the second week of the year, markets will hit 261 weeks since the bottom at Christmas 2018. Expect a wild ride in 2020.
Happy new year!
If you want more information, go to: Lucaswaveinternational.com and sign up for the free newsletter.


