
Could last week’s high be the yearly high, asks Al Brooks.
The E-mini S&P 500 broke above last year’s high, but there was immediate profit-taking on Friday’s Iran news. The bears want a two- to three-week reversal down. However, they will need at least one or two bear bars first.
The monthly E-mini S&P500 futures chart had four consecutive bull bars prior to this month (see chart). The bulls want another one in January. But the E-mini is at the top of a 10-year bull channel. That will probably limit the extend of a rally from here. Also, four bull bars coming 10 years into a bull trend is fairly extreme. That increases the chance of a pause within a couple months.
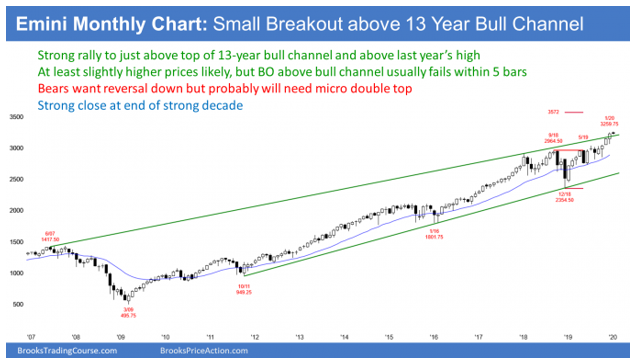
But four big bull bars closing near their highs is a sign of strong bulls. That limits the downside risk over the next few months. This is true even if the bears were able to create a bear bar in January. The best the bears can probably get over the next few months is a one- to two-bar (month) pullback. Traders should continue to expect the E-mini to trade sideways to up.
Breakout above last year’s high
I talked last week about the yearly chart. That is a chart where each bar is one year. I said that last year was the biggest bull bar in a 10-year bull trend. It was therefore climactic and unsustainable. This year would likely be less strong. Furthermore, within the next three years, the E-mini will probably begin to go sideways for the next decade.
However, this year was likely to break above last year’s high. The bulls accomplished that goal on Thursday, the first trading day of the new year and new decade. But it pulled back below last year’s high on Friday.
The bears hope that the breakout will fail and that this week will be the high for the year. They want the year to close on its low so that it will be a sell signal bar on the yearly chart.
We are only two days into the year. The bears currently have only a small chance of achieving their goal at this point. But if they get two or three consecutive bear bars on the monthly chart, more traders will suspect that we have seen the high of the year.
The weekly E-mini chart traded above and below last week’s range. Last week was therefore an outside bar (see chart). Its close was near the open and therefore the week was a doji bar, which is neutral. Since last week was small, these two weeks are a sign of a loss of momentum.
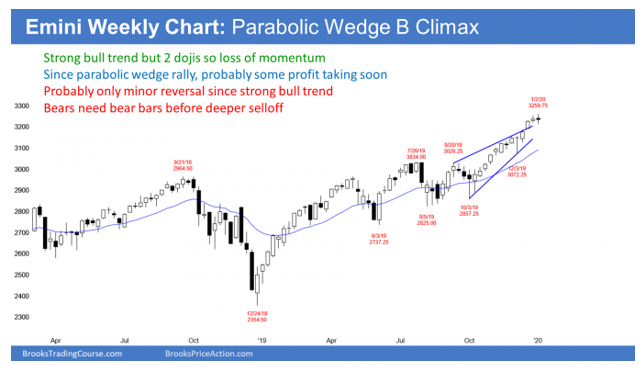
Since the three-month bull trend has been strong, traders will buy the first one- to three-bar pullback. Consequently, the downside risk over the next few weeks is small.
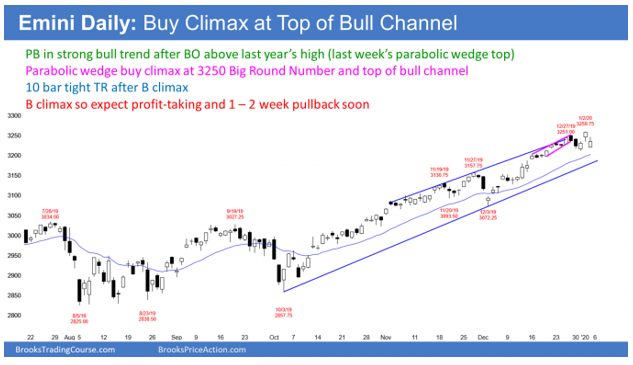
The daily E-mini futures chart has been in a Small Pullback Bull Trend for three months. However, it has been trading sideways for two weeks. That means that the bulls are not as strong as they have been. This increases the chance of some profit-taking and a two- to three-week pullback.
The bears want a bear breakout below the two-week range and then a measured move down. That would be to around the three-month bull trend line.
Can the bears retrace the entire three-month rally? Probably not without a bigger top. Any reversal down at this point will be minor. The bulls will buy it, expecting at least a test back to the high.
Trading Room
Traders can see the end of the day bar-by-bar price action report by signing up for free at BrooksPriceAction.com. I talk about the detailed E-mini price action real-time throughout the day in the BrooksPriceAction.com trading room. We offer a two-day free trial.


