
There is now a minor sell signal on the E-mini S&P 500 monthly chart.
The E-mini S&P 500 is down 4%. Two weeks ago, I said it would probably fall at least 5%, starting within three weeks. It started three days later. Friday’s Bear Surprise Bar makes it likely that the E-mini will fall at least to 3170, which is a 5% correction.
The monthly E-mini S&P 500 monthly futures chart formed a small bear reversal bar in January (see chart below). The bears wanted January to be a big bear bar closing on its low. It would then have been a stronger sell signal bar for a failed breakout above the 13 year bull channel.
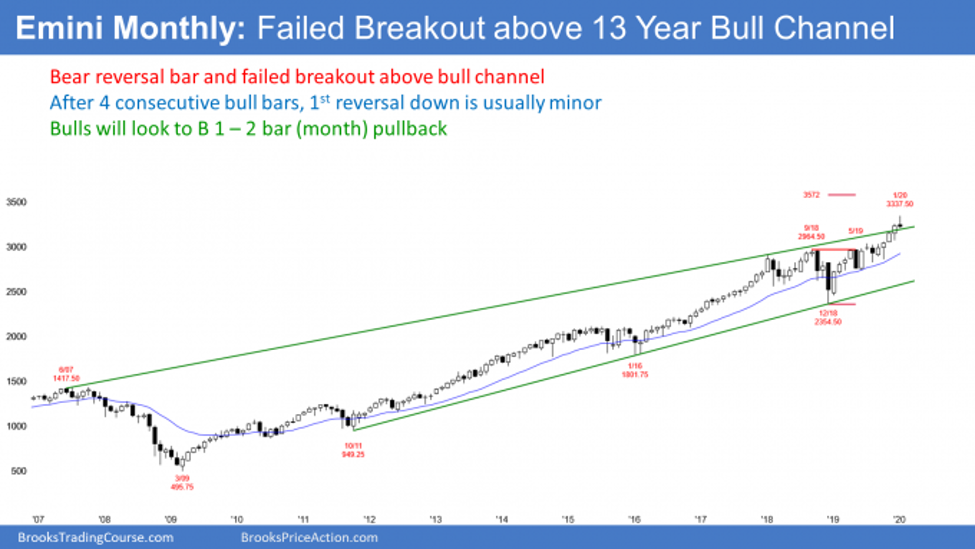
I have written several times about the bull channel. I kept making the point that a breakout above a bull channel typically reverses back down within five bars. January is the second bar of the breakout and it is reversing down. (I will be addressing this in detail at the Money Show Orlando on Feb. 8.)
However, the prior four months were all bull bars closing near their highs. While climactic, that is a strong bull breakout. Traders believe that the first reversal down will be minor and that there will then be at least a small second leg up.
A minor reversal is often just a one- to two-bar pullback. Since this is a monthly chart, traders expect any selling to last a month or two. The bears will probably need at least a micro double top before they can get more than a two-bar reversal down.
It is important to consider what will happen if February is a big bear bar closing near its low. Traders would then look for the selloff to test the middle of the channel at around 2900.
The E-mini S&P 500 futures traded below last week’s low on the weekly chart (below). It therefore triggered a minor weekly sell signal.
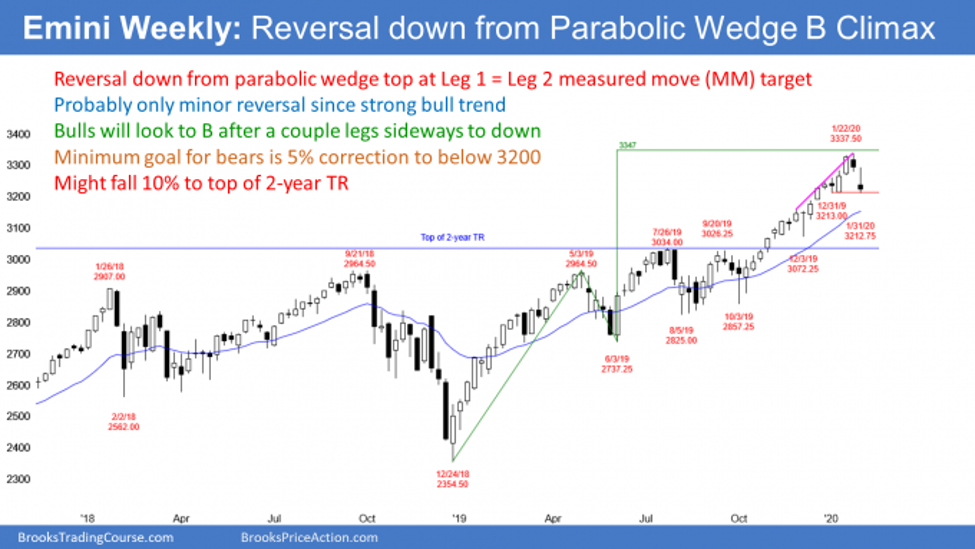
The sell signal was at the top of the third leg up in a four-month tight bull channel. That means that the rally was a parabolic buy climax. After an extreme buy climax, traders expect more than a one-bar pullback.
Furthermore, I wrote two weeks ago that the E-mini would soon begin a 5% correction. That is because the second big bull bars on the weekly chart in mid-January formed the strongest consecutive bull bars late in a bull trend.
When that happens, there is a 60% chance that the next week will be the top, or there will be one more brief leg up and that will be the top.
There was a similar pattern in January 2018. That time, there was a one bar second leg up, and then a 10% correction. This time, the E-mini immediately reversed after the second buy climax bars.
Can the correction end at 4% instead of 5%?
Last week’s low is 4% from the high. It reached the bottom of the second big bull bars on the weekly chart. I have been saying that the bottom of the most recent buy climax was the first target once there was a reversal. The bears reached that target in Friday.
Can the E-mini form a double bottom with that low and resume up this week? There are several problems with this. Friday’s selloff was surprisingly strong on the daily chart. A Bear Surprise Bar typically has at least a small second leg sideways to down. Also, a reversal down from a buy climax typically has at least two legs down.
Next, another common target after a buy climax is a test of the 20-week exponential moving average. That is now around 3160. Then there is the issue of psychological support.
Psychological support
Psychological support can be important. Many traders simplify how they think of the market. That makes round numbers like 100, 500, 1000, 3,000 etc. important. For example, 3000, 3100, 3200, and 3300 have all been magnets in the E-mini.
In terms of pullbacks, traders look to buy when the market has fallen 1%, 2%, 5%, 10% or 20%. Look at last year. There were many pullbacks that ended almost exactly at 5%, 10% or 20%. Once a selloff approached the target, many bulls stopped buying. They knew that a pullback that gets near support, even psychological support, will usually reach the support before reversing up.
The current selloff is now 4%. Many bulls will not buy unless it falls to at least 5%. The result is that a 4% pullback usually grows into a pullback that is 5% or more.
The E-mini futures daily chart had several big days up and down over the past couple of weeks (see below). Because of the consecutive big bull bars on the weekly chart, I wrote two weeks ago that the E-mini had a 60% chance of beginning at least a 5% correction within three weeks. It began a few days after my report.
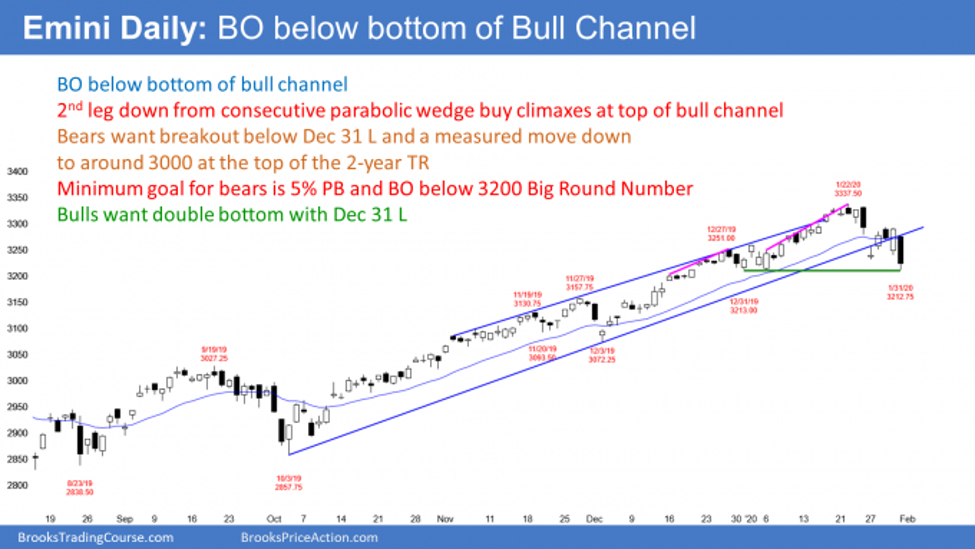
Friday was the biggest bear bar on the daily chart since the corrections from July to October last year. When a bar is surprisingly big, many bears missed the short and want to short a rally. There are many bulls who now have decided that their longs are bad. They, too, want a rally so that they can exit with a smaller loss.
With both bulls and bears looking to sell the first two- to three-day rally, there will usually be at least a small second leg sideways to down. As a result, traders expect that the first reversal up from a Bear Surprise Breakout will be minor. They will not aggressively buy until there is at least one more leg down and then a second attempt to reverse up.
It is important to remember that the four-month bull trend has been strong. If the E-mini reverses up strongly next week, traders will conclude that the correction is over. Currently, there is a 70% chance of at least slightly lower prices.
Why might the correction reach 5%?
A selloff from a buy climax typically tests the bottom of the most recent leg up. That is the Jan. 6 low of 3213.25, which is about a 4% correction. Traders like 2%, 5%, 10% and 20% corrections. Many look to buy at those levels. Four percent is near 5%. Many bulls will not buy until they get that extra 1%.
Also, the 3200 Big Round Number is a magnet, and it is below that Jan. 6 low. Consequently, traders will expect at least a 5% correction, which is at 3170.
The four-month rally broke above a two-year trading range. Markets usually come back to test the breakout point. If the bulls buy again at that price, traders will be more confident that the trend up will continue. Therefore, traders must consider the possibility of a pullback to the top of the two-year range at around 3000.
If it happened, the pullback would be about 10%. But traders see the monthly and weekly bull trends as strong. They will therefore buy a reversal up from the pullback, whether it is 5% or 10%.
Trading Room
Al Brooks will be speaking at the MoneyShow Orlando this week. Make sure to see his presentation—either in Orlando or live streamed through the web—on Trading When a Market Is in a Bull Channel.
Traders can see the end of the day bar-by-bar price action report by signing up for free at BrooksPriceAction.com. I talk about the detailed E-mini price action real-time throughout the day in the BrooksPriceAction.com trading room. We offer a two-day free trial.


