
While the E-mini S&P has started the year strong, it could be over-extending and due a correction, writes Al Brooks.
The E-mini S&P 500 is accelerating up and it is above the top of the daily, weekly, and monthly bull channels. There is a 60% chance that 5% correction will start within a few weeks.
The E-mini S&P 500 futures has rallied strongly for five months. There is no sign of a top on the monthly chart (see below). This month so far is at the high. This is an extremely strong bull trend. But traders are wondering if it is too strong.
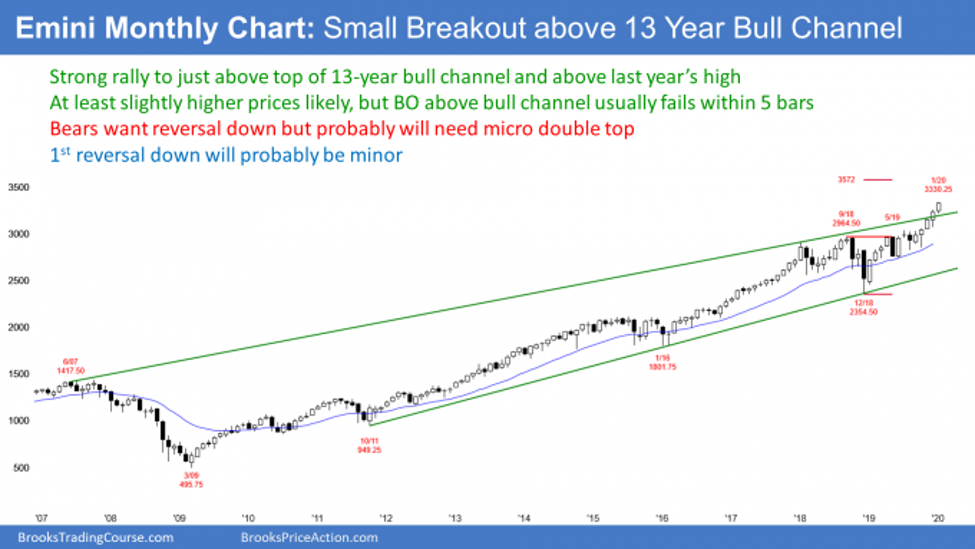
This increases the chance of some profit-taking coming soon. But when a trend is strong like this, traders will buy the first one- to two-bar pullback. Consequently, the downside risk in terms of the duration of a selloff is small over the next few months.
However, there have been several one- to two-month pullbacks over the past two years where the E-mini fell about 10%. Therefore, while a pullback might not last long, it could be relatively sharp. In fact, there will probably be at least one or two 5% to 10% pullbacks in 2020.
But currently, there is no credible top and traders are continuing their buying. Also, they will buy the first pullback on the monthly chart.
The 2020 candlestick likely neutral
It is important to remember what I recently said about the yearly chart. By a yearly chart, I mean a candlestick chart where each bar is one year.
I said that 2019 was a huge bull trend bar closing near its high. It was the biggest bull bar in a 10-year rally. When the biggest bull bar comes late in a bull trend, it typically attracts profit-taking. The next bar is usually not another big bull bar. More often, it is a neutral bar or even a bear bar.
A neutral bar is one that closes somewhere in the middle third. That means that the bar has a conspicuous tail on the top and on the bottom.
The tail on the top comes from a rally and then a selloff. Traders should therefore expect that there will be a selloff back to around the open of the year at some point this year. Also, if the selloff continues far below the open, there will probably be a bounce late in the year so that the year will close somewhere in the middle third of its range.
The E-mini futures has been in a bull breakout for four months on its weekly chart (below). There have been two brief pullbacks, but most of the candlesticks have had a big bull body and a close near the high of the bar.
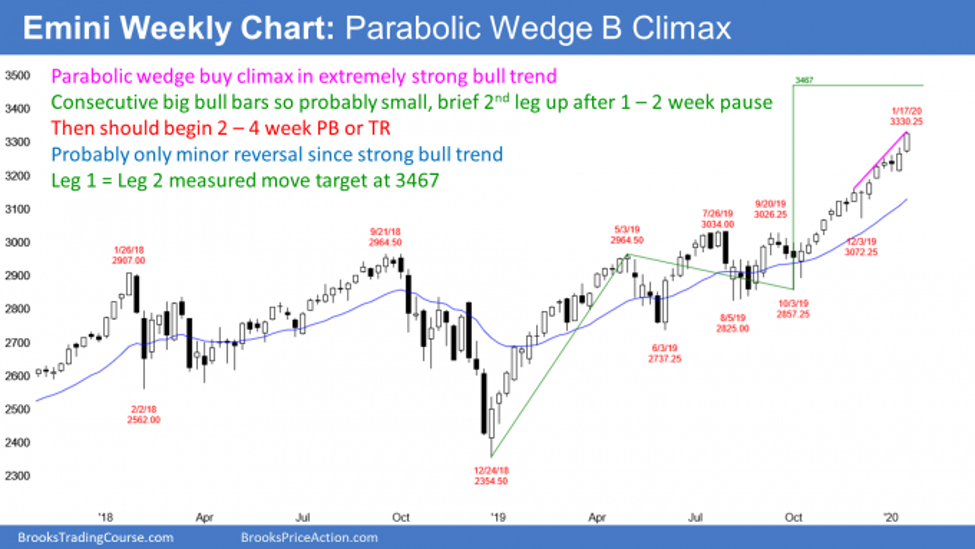
There is no sign of a top. The bears typically will need at least a micro double top or consecutive buy climaxes before they can get more than a two-week selloff. Since both patterns require at least a few bars, the downside risk over the couple weeks is small.
Why a pullback should begin in about 3 weeks
Everyone knows that the rally is unusually strong and it has lasted a long time. Traders are looking for a reason to take profits. The weekly chart is giving them one.
The past two weeks formed the strongest breakout in the four-month bull trend. It is providing the bulls with a great price for profit taking. Many bulls will probably soon take advantage of this opportunity because they will be afraid that it might be brief.
The two most recent bars have surprisingly big bodies and closes near their highs. When there is a Surprise Breakout late in a bull trend, there is a 60% chance that it is the end of the current rally or that the rally will have one more final leg up. More often than not, there is a one- to three-bar (week) pause or pullback from the second bull bars and then a one- to two-bar final rally.
That second leg up typically exhausts the bulls. The exhausted bulls take profits and the aggressive bears short. The result is usually at least a 10-bar pullback that has at least two small legs.
What to expect over the next month
The E-mini will probably pause for a week or two, have one more one- to two-week surge, pull back for a month or two, and then resume up to at least to the old high.
At that point, the picture gets confused. Confusion typically results in a trading range. The bulls want the bull trend to continue indefinitely and the bears will try to create a double top and a major trend reversal. They will probably alternate control over several months before one side wins.
From what I wrote above about the yearly chart, traders should also assume that the E-mini is creating most of the year’s gains in the first quarter. A buy climax usually leads to a lot of trading range trading. Traders should expect many months of sideways trading this year.
Why should traders expect a 5% correction?
A common target for a pullback after a buy climax is the bottom of the most recent leg in the bull trend. That is last week’s low of 3213.25, which means about a 5% correction. It could be more and it could last longer, but that is a reasonable objective.
It is important to note that the E-mini is above the top of the daily, weekly and monthly bull channels. Traders typically take profits above bull channels. That is another reason to suspect that this rally will soon stall.
Obviously, if the E-mini continues up without a pause, it could go a lot higher. However, this setup is similar to the pattern of January 2018. That is why in mid-January 2018 I wrote that traders should expect at least a 5% correction beginning within a couple weeks. The E-mini fell 10% over the next month.
Is Blowoff Top coming?
The daily E-mini futures chart has been in a Small Pullback Bull Trend for four months (see chart below). The bull channel is tight and every pullback has lasted only one- to three-bars (days).
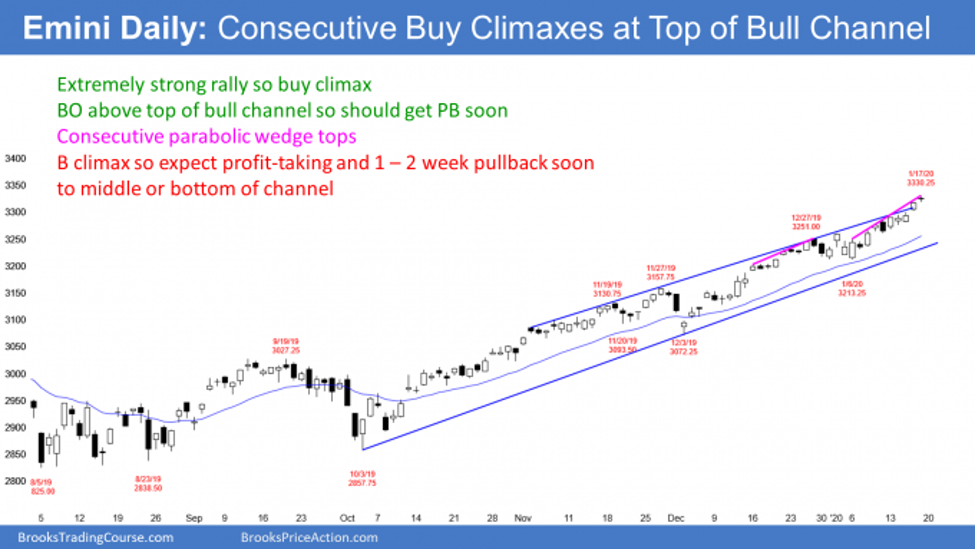
The bull trend accelerated over the past week. The rally is breaking above the top of the tight bull channel.
Can this breakout be the start of an even stronger bull trend? That happens only 25% of the time. More likely, it will be an exhaustive move. That is also called a blow-off top.
Until there is a reversal, the odds continue to favor higher prices. However, there is a 75% chance that a bull breakout above a bull channel will begin to reverse back down within about five bars.
Last week’s star doji could be the start of the pullback. A gap down next week would create an island top with Friday’s gap up. But remember, most island tops lead to pullbacks and not bear trends.
First selloff will probably be brief
If the E-mini pulls back this week, it will create that one- to two-week pause on the weekly chart that I discussed above. The weekly chart will then probably have one final one- to two-week push up before a 5% correction begins.
A reasonable target for a pullback this week is the middle or bottom of the tight bull channel. That is around the bull trend line. The bull trend line is around the 20-day exponential moving average, which was support in early December and again in late December. There will probably be some support there again this time. Remember, there will probably be one more one- to two-week rally after the pullback.
While the odds of a pullback are growing, this is a very strong bull trend. There is no sign of a major top. Traders should assume that the market will be higher a few months from now. A 5% correction is a minor reversal and not be the end of the bull trend. But it might be the start of a trading range.
Trading Room
Traders can see the end of the day bar-by-bar price action report by signing up for free at BrooksPriceAction.com. I talk about the detailed E-mini price action real-time throughout the day in the BrooksPriceAction.com trading room. We offer a two-day free trial.


