
In July we highlighted bullish V-patterns in the major stock indexes. These patterns could be preparing for the next leg up, writes Suri Duddella.
In July 2019, we highlighted V-Bottom chart patterns in major indexes: the S&P 500 (SPX), Sow Jones Index (INDU), Nasdaq Composite (COMPX), and Technology Select Sector SPDR ETF (XLK) and are poised to move up in the article "Major Indexes Poised to Breakout."
Here we update those four charts as they reached its first target zones and describe its potential to reach its next targets.
V Patterns
As the name implies, the "V" chart patterns have the letter "V" shape and prices shift their momentum from an aggressive sell-off to aggressive rally in its structure. It is relatively a rare pattern with extreme angles and maybe not easy to recognize until it is mostly formed, which is why we do not attempt to predict the initial reversal. The V-Pattern is a powerful reversal pattern seen in all markets, all time-frames and in all instruments. The "V" pattern consists of rapid price action and may not be suited for all casual investors. The "V" patterns are formed when its trend is sharply switched from bearish to bullish (in case of V-Bottom) or bullish (or sideways) to bearish (in case of V-Top patterns).
Trading V-Patterns
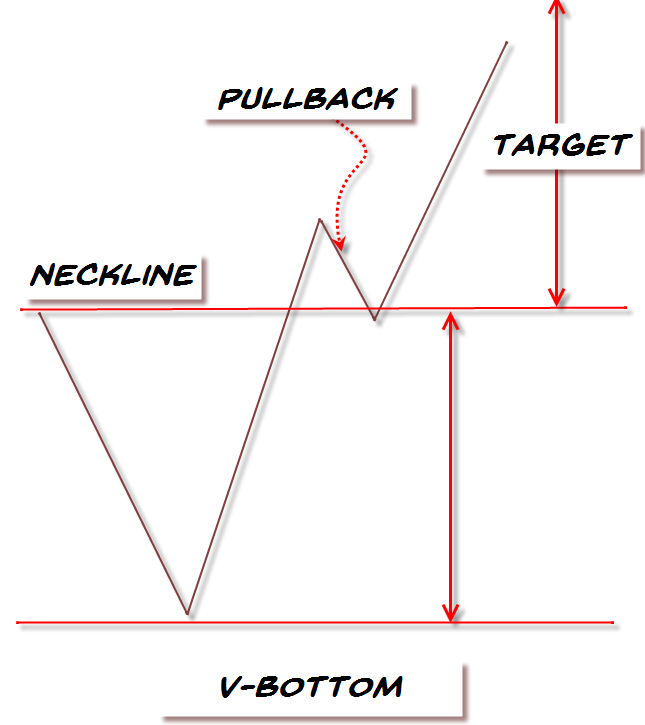
The critical aspect of the V pattern is it must have a sharp downtrend followed by a quick and sharp uptrend reversal. Look for a one- to three-bar reversals at the bottom of the pattern to signify the sharp reversal process. The volume increases during both the phases of the breakdown (down-shift momentum) and breakout (up-shift momentum). There are a few ways to trade this pattern, but the most conservative way is to trade a long entry once the pattern is complete and retraced back to the neckline (as a pullback).
Aggressive traders may enter on the trendline breakouts at the bottom, but the success rate with simple trendline breakouts is low (52%) compared to the neckline breakout (64%) reaching its first target range 62% of its size from breakout level (see graphic below).
The key factors of the pattern identification:
1. Sharp Downtrend
2. Sharp Uptrend
3. V shaped Pattern (usually 1-3 bars reversals)
4. Volume increase in both breakdown and breakout phases
5. Breakout over neckline
6. Pullback to the Neckline
7. Target
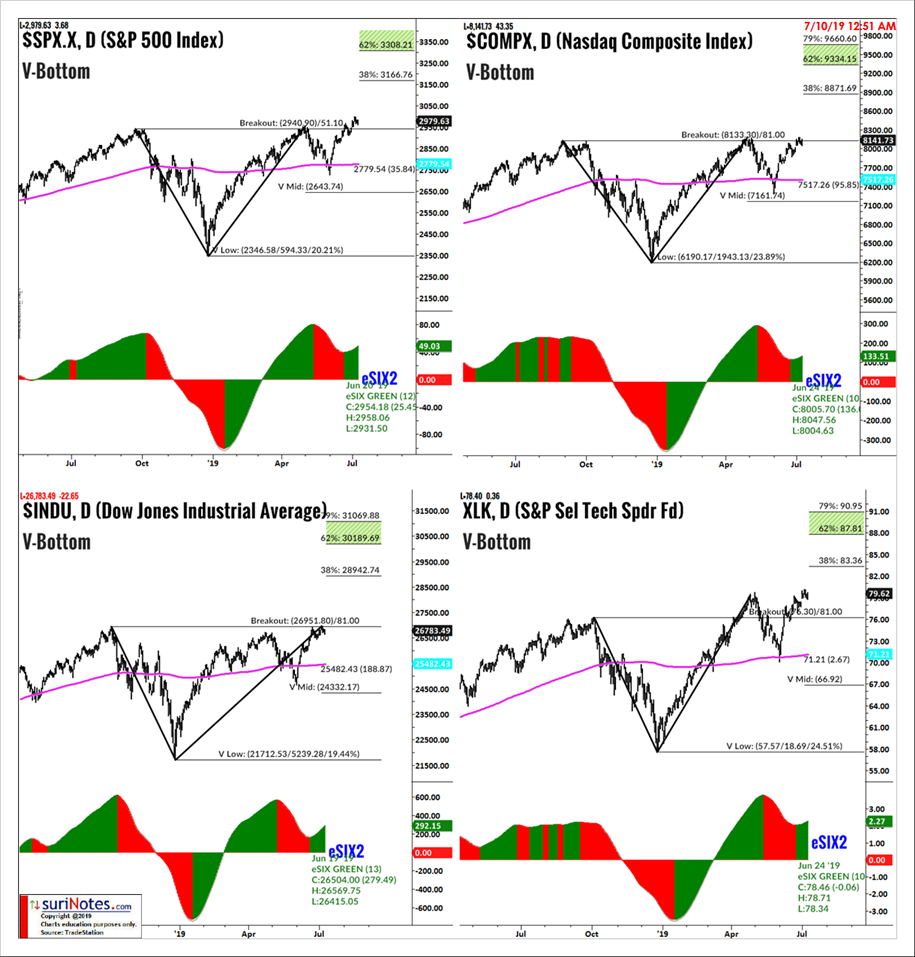
Here are the major indexes charts with V-Bottom patterns published on July 10, 2019 (see charts below). These charts show major indexes have completed the V-Bottom pattern pullback and are about to move up after a successful breakout from the patterns. In July 2019, these patterns 1st target zones were as follows: $SPX 3308-3408, 3535, $INDU: 30189-31069, 32191, $COMPX: 9334-9660, 10076 and XLK: 87-91, 100-106.5
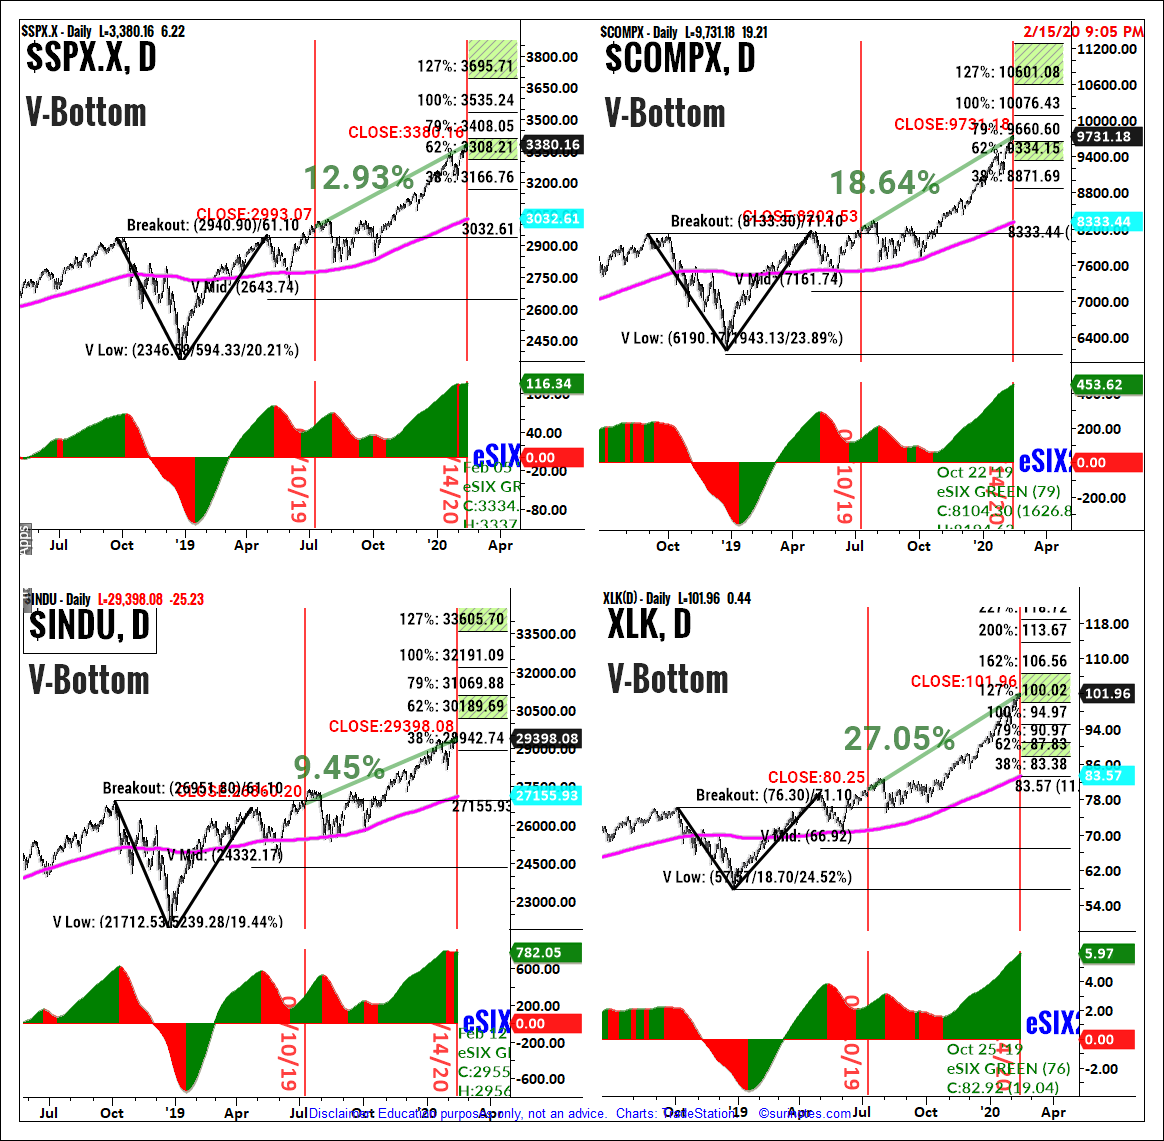
The following charts show the same indexes with V-Bottom patterns and their targets on Feb. 15, 2020.
- $SPX: Since its breakout, the S&P 500 V-Bottom pattern reached its first target zone in February 2020 after gaining 12.93% from July 10, 2019. Its next target levels are 3535-3695.
- $COMPX: The Nasdaq Composite broke out of the V-Bottom pattern at 8133. Its V-Bottom pattern targets are 9334 to 9660. In February 2020, $COMPX reached its target levels with a gain of 18.64% (from July 10, 2019), and its next target levels are 10076 and 10601.
- $INDU: The Dow Jones Index broke out of the V-Bottom pattern at 26951 with targets set at 30189-31069. $INDU gained 9.45% but has yet to reach its first target zone of 30189 to31069.
- XLK: The Technology Select Sector SPDR ETF made a breakout of the V-Bottom pattern at $76.30. Its target zones are $87, $91, $100 and $106.50. XLK reached its first target ($87-$91) in December and second target zone ($100 to $106.5) in February 2020 by gaining 27.05%. XLK's next targets are $106.50 to $113.5.
Find more of Suri’s work at surinotes.com.


