
The S&P 500, Dow Index, Nasdaq Composite and the Technology Select Sector SPDR Fund (XLK) have complete V bottom patterns, notes Suri Duddella.
One of the key trading patterns in markets is the "V Chart Pattern. In May we explained the importance of patterns in markets and the V Chart Pattern in particular.
Here we present examples of how to trade it. Please note, all V-patterns are classified as a bullish "V-Bottom" and complimentary bearish patterns ("V-Top").
V Patterns
As the name implies, the "V" chart pattern forms the shape of a “V" and prices shift their momentum from an aggressive sell-off to aggressive rally in its structure. It is a relatively rare pattern with extreme angles and maybe not easy to recognize until it is mostly formed, which is why we do not attempt to predict the initial reversal. The V-Pattern is a powerful reversal pattern seen in all markets, all timeframes and in all instruments. The "V" pattern consists of rapid price action. The "V" patterns are formed when its trend is sharply switched from bearish to bullish (in case of V-Bottom) or bullish (or sideways) to bearish (in case of V-Top patterns).
The signal comes after the V is complete.
The key factors of the pattern identification:
1. Sharp Downtrend
2. Sharp Uptrend
3. V shaped Pattern (usually 1-3 bars reversals)
4. Volume increase in both breakdown and breakout phases
5. Breakout over neckline
6. Pullback to the Neckline
7. Target
In June we highlighted how the Renaissance IPO ETF (IPO), was nearing a V Pattern breakout. Our signal was hit and the position is positive, though still not close to our target.
We bring this up because four major indexes have complete V bottom patterns and are poised to breakout (see chart).
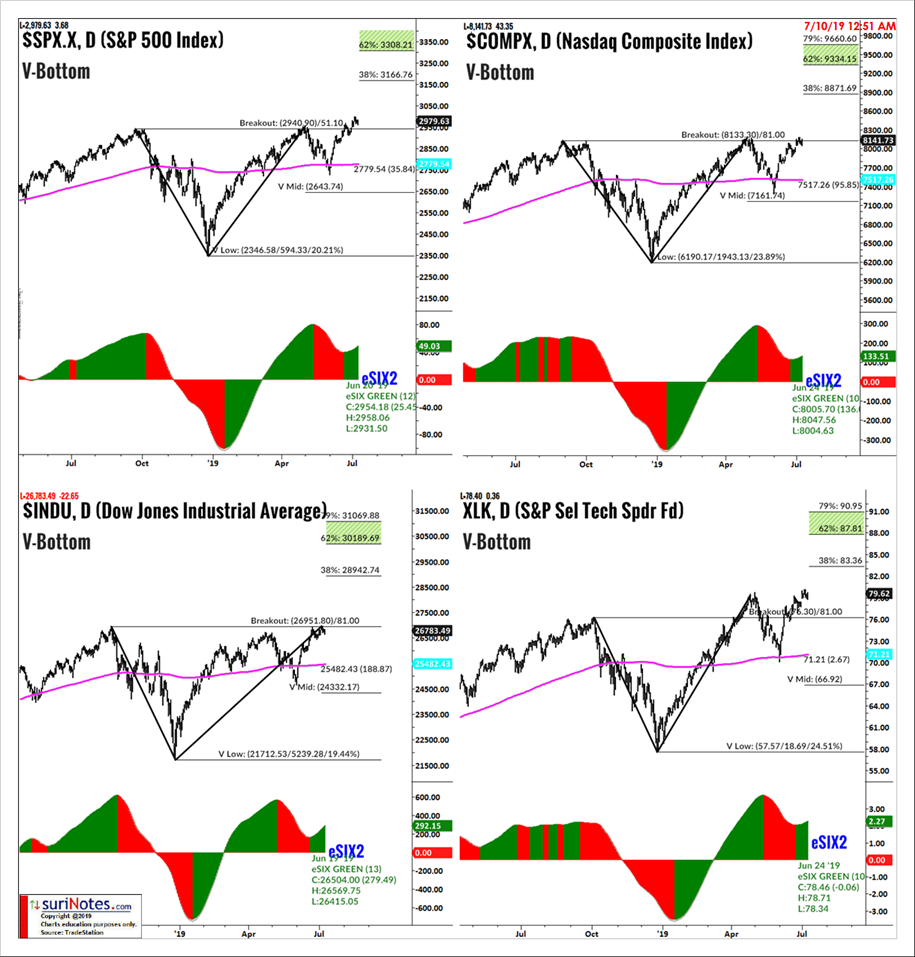
The S&P 500 (SPX), Dow Jones Index, Nasdaq Composite and Technology Select Sector SPDR Fund (XLK) have complete V Patterns and are poised for a move.
Find more of Suri’s work at surinotes.com


