
While we would not try to predict the end of a four-decade move, bond yields look oversold and ready to at least correct, writes John Rawlins.
With all the volatility surrounding equities lately, some folks may have not kept an on the Treasury futures markets that have had an even more dramatic move.
Yields of the U.S. 30-year Treasury bond, 10-year Treasury note and the entire curve have dropped to record lows (record high prices).
On Tuesday the 10-year note yield dropped below 1% for the first time ever.
Many analysts assumed that the bull market in equities, which began in the 1980s and has entered its fourth decade ended with the peak in 2016, but that has proven not to be the case (no can be sure when a 35+ year trend is over until it is confirmed, which can takes years).
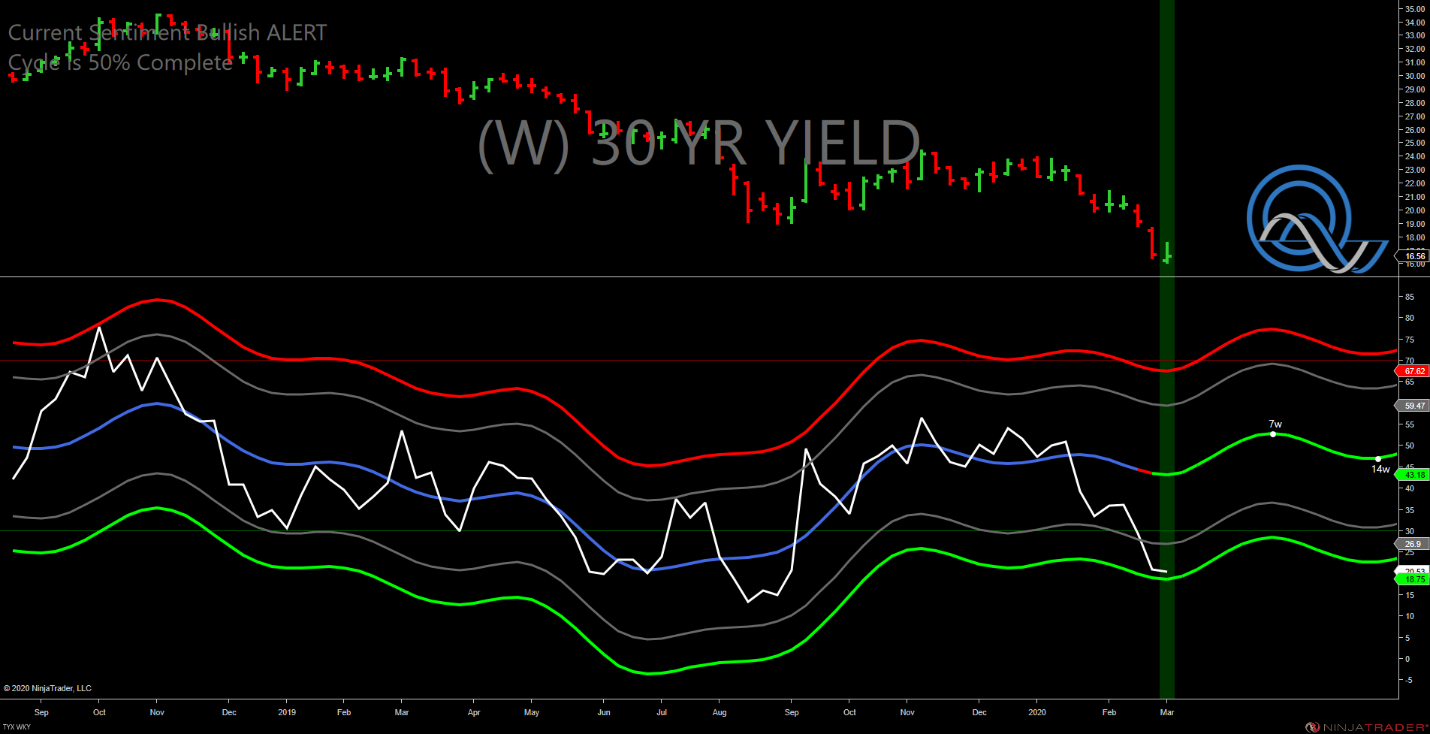
With the huge rally in bonds (drop in yields/yields go down as bond futures prices rise) the 30-year bond yield has fallen into extreme oversold territory on the QuantCycle Oscillator weekly yield chart (see below).
As you can see the oscillator expect yields to rise over the next seven weeks, and that is coming from extreme oversold territory.
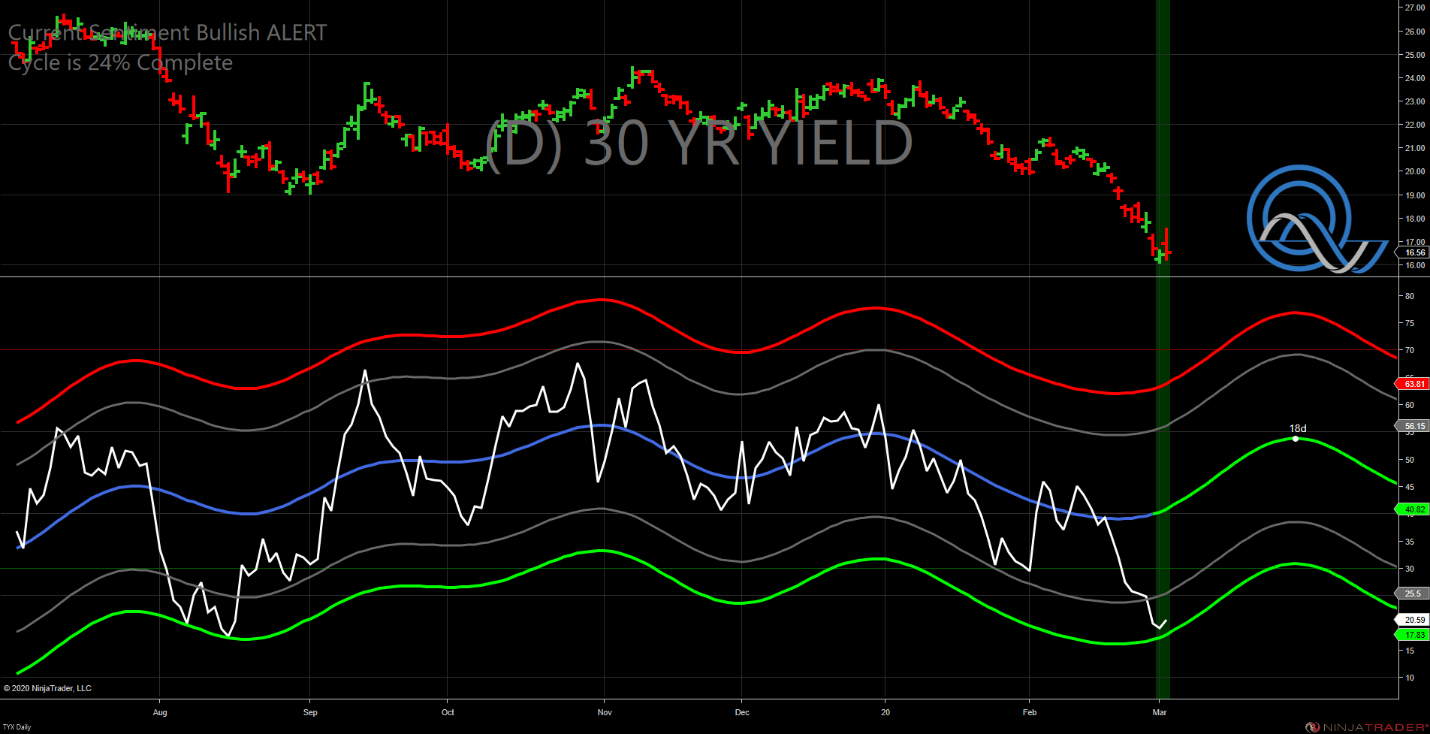
As you can see the daily oscillator is also in extreme oversold territory and has also recently turned bullish. The oscillator has turned higher over the next four weeks.
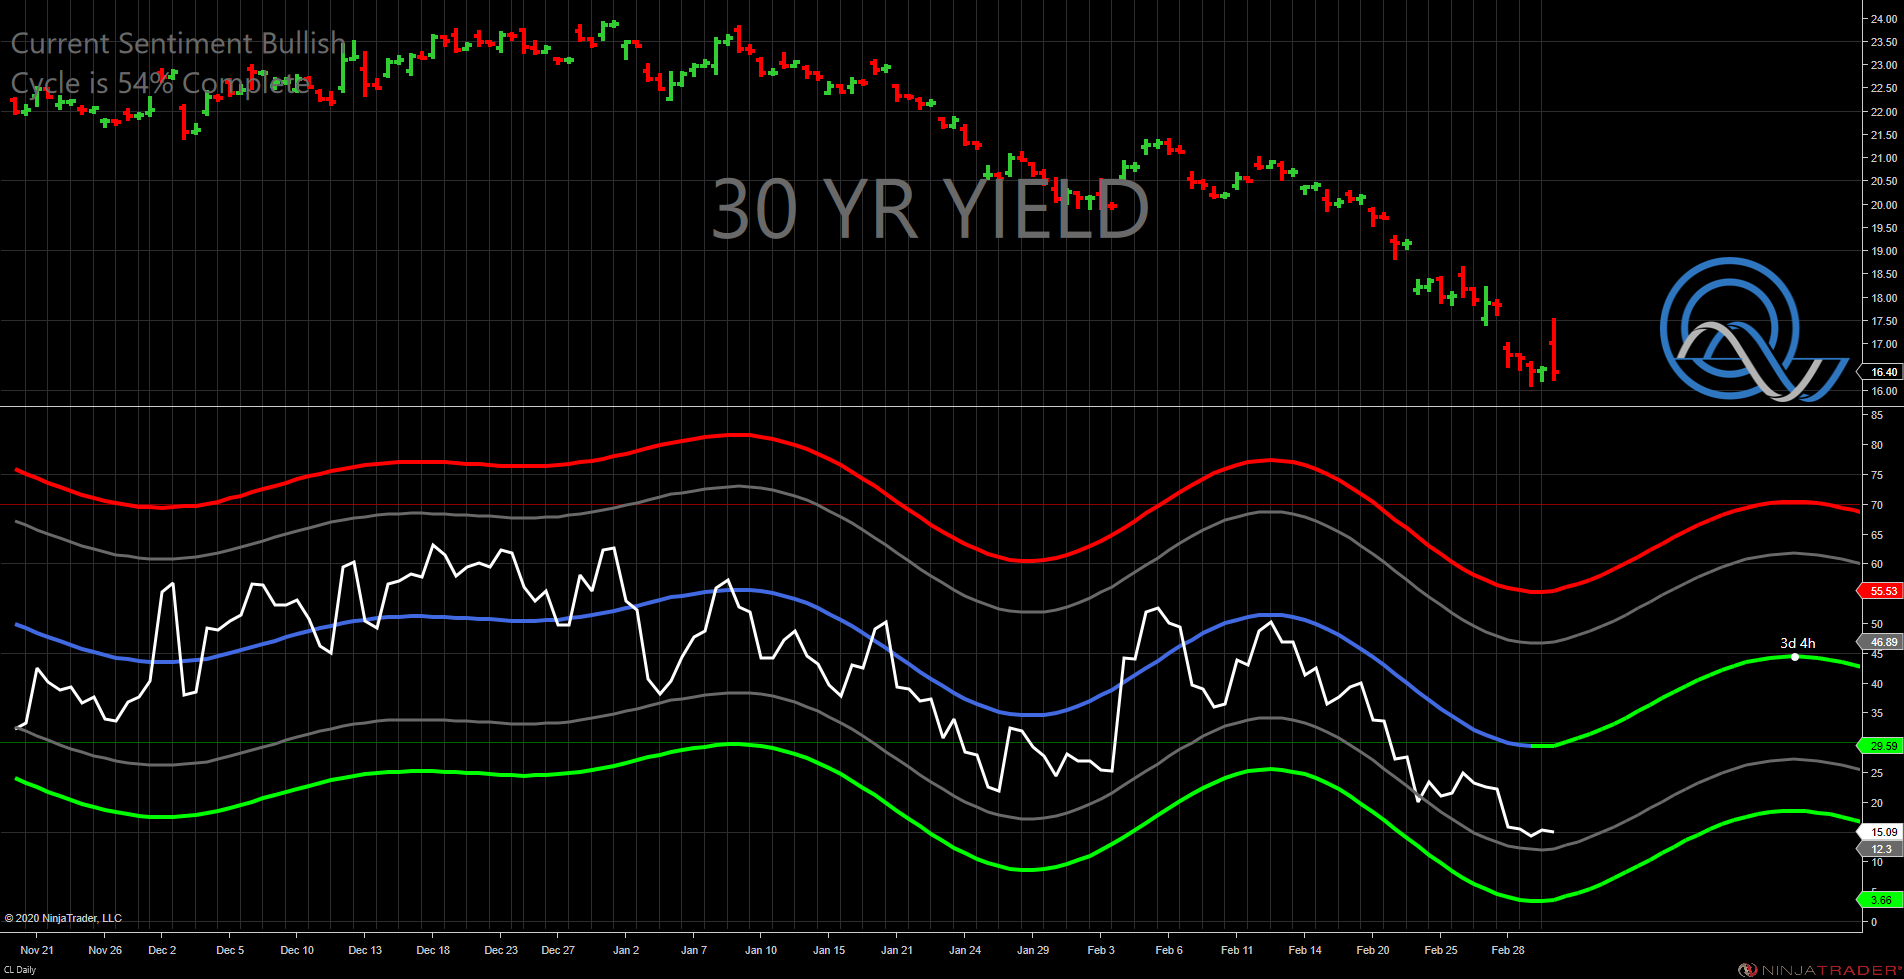
Breaking this down further, the four-week oscillator has also turned higher from an oversold position.
There is clearly a reversal at hand.
No one can predict the end of a 35+ year trend, but given the recent volatility, and today’s turn (the chart was created Tuesday evening) this may be as close and anyone gets.
Of course, even if this is not the end of a major trend, at these levels, it doesn’t matter because corrections can be extremely large encompassing multiple handles and netting huge profits.
John Rawlins described the value of the QuantCycles Oscillator recently at The Orlando MoneyShow.
The QuantCycles indicator is a technical tool that employs proprietary statistical techniques and complex algorithms to filter multiple cycles from historical data, combines them to obtain cyclical information from price data and then gives a graphical representation of their predictive behavior (center line forecast). Other proprietary frequency techniques are then employed to obtain the cycles embedded in the prices. The upper and lower bands of the oscillator represent a two-standard deviation move from the predictive price band and are indicative of extreme overbought/oversold conditions.


