
Whether this is the absolute end of the bull market or a sign of a double bottom, bottom, expect more selling ahead, writes Al Brooks
The E-mini S&P 500 is in an early bear trend on the daily chart and probably the weekly chart. The bulls want a double bottom with last week’s low. However, the best the bulls can probably get over the next several weeks is a trading range. There is at least a 50% chance of a 20% correction, which would be a bear market.
In December, the E-mini was breaking above the top of a 13-year bull channel. There was a 75% chance of a reversal to the middle or bottom of the channel beginning within five bars (months). It began two months later.
The E-mini is already back to the middle of the bull channel. Since February was a Bear Surprise Bar (see chart below), there will probably be at least a small second leg sideways to down after the first pause.
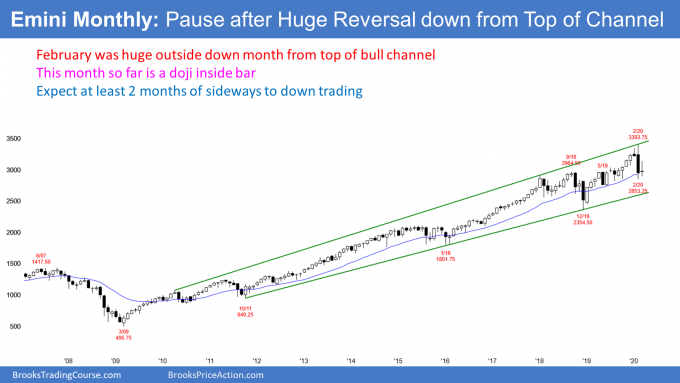
Bear inside bar/Second leg down likely
The monthly S&P 500 E-mini futures has a bear inside bar after February’s collapse. Look back over the past two years. There were several bear bars, but no consecutive big bear bars.
Also, the 11-year bull trend is still in a tight bull channel. This selloff still could end up as a pullback in the bull trend or the two-year trading range instead of the start of a bear trend on the monthly chart. But even if it is, traders should expect a bear trend to begin within a couple of years.
The bulls see February as simply a brief, sharp pullback to the 20-month exponential moving average. That has been support for four other selloffs since December 2018 low. There are probably enough bulls expecting it to be support again to prevent March from becoming a second consecutive big bear bar. However, it will probably not be enough to prevent at least one more leg down if there is a one- to two-month pause or bounce.
Technicals more important than the coronavirus for E-mini
There are some significant technical problems for bulls. They will probably limit the upside for many months and possibly several years. During the 2017 buy climax, I repeatedly made the point that the rally was the most extreme buy climax in the history of the stock market. I said that there would soon be profit taking and it could last a long time. It lasted a couple years.
It is important to note that during each strong selloff, I said that each was likely to be minor because the bull trend was so strong. However, I also made the point that the resumption up after an extreme buy climax is typically brief. It is then often followed by a deeper correction. The 2019 rally was the resumption up. February might have ended the 12-year bull trend.
Trading range for the next 10 years
For three years, I have been saying that the market would likely top out within five years and that the next 10 years would probably be in a trading range. This happened in the 1970’s and again in the 2000’s. Both trading ranges lasted about a decade and both followed strong bull trends. That is what is likely this time as well.
How do we know if the bull trend is over? It is still too early to tell. We need more information. For example, if the E-mini sells off to 2018 low and then fails to get above this year’s high for a year or more, traders will begin to conclude that the bull trend had evolved into a trading range.
When the market is in a trading range, it often makes one or more new highs, but fails to break far above the old high. Traders lack confidence that the bull trend will resume. Instead of buying a strong breakout to a new high, the bulls take profits. Also, the bears short, confident that the breakout will fail.
The opposite happens at the bottom. The result is a series of strong legs up and down that can last a long time.
The trading ranges in the 1970’s and the 2000’s both had at least a couple selloffs of 40% to 60%. If the market is entering a trading range, that will probably be our future over the next decade.
It will be more of a trader’s market and a stock pickers market. There will always be another Amazon (AMZN) or Netflix (NFLX), but far fewer than over the past 10 years. Finding the next hot stock will be impossible for most people.
Buying and holding will probably be disappointing. This is unfortunate because the baby boomers are starting to retire. They were counting on consistent, modest profits on their stocks. If the next decade is a trading range, they will make little or no passive income from their portfolios.
It’s the economy, stupid, not coronavirus
These technical forces have been working for several years. The Coronavirus (Covid 19) scare caused the selloff to come now and made it extremely big and fast. But it was going to come regardless. No one knew what black swan would start it or precisely when it would start.
Once there is a vaccine, the Coronavirus will no longer be a problem. That means it could affect the market for a year.
But what if I’m right and the market is in a trading range for a decade? Can you still blame the Coronavirus? Of course not. The economists will come up with all kinds of economic explanations.
I have a simple explanation. The stock market was the most overbought in history. It needs a long time for the fundamentals to catch up with the price. It will probably take a decade.
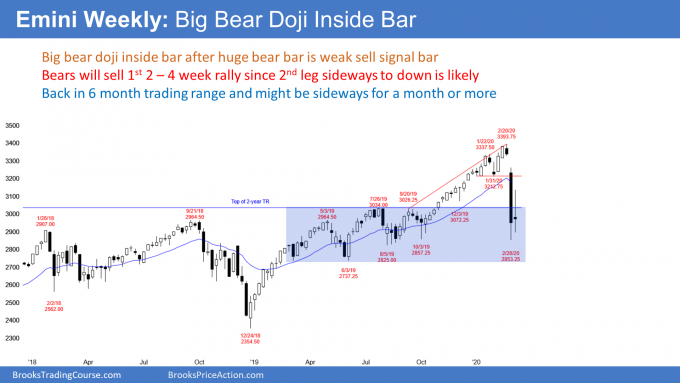
The weekly E-mini futures chart formed an inside bar last week. It is a Low 1 sell signal bar for the previous week. Because it was a doji bar, it is a less reliable sell setup (see chart). There might be more buyers than sellers below its low. This could result in several sideways bars on the weekly chart.
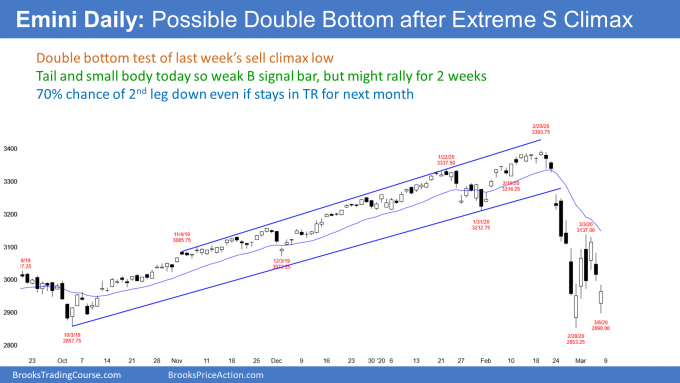
The daily E-mini chart is testing the recent low. Friday was a relatively small day. It is therefore a weak buy signal bar for a higher low double bottom with the Feb. 28 low.
The February selloff was surprisingly strong. It will therefore probably dominate the price action for more than a couple weeks. That reduces the chances that a double bottom reversal will lead to a resumption of the bull trend. The best the bulls can probably get over the next few weeks is a bear rally. That means a leg up in a developing trading range.
It could retrace more than half of the selloff. But traders should expect sideways to down trading for at least another month.
50% chance of bear market
What is the difference between a bear trend and a bear market? Over the past couple of decades, institutions have come to agree that the term “bear market” means at least a 20% selloff from the all-time high. This is true for any market. They are not looking at anything else. Therefore, this has nothing to do with charts or technical analysis.
When you hear the word trend, you immediately picture a chart. It is therefore a term that chartists use, and everyone has his own definition. There is the agreement that a bear trend means a series of lower highs and lows.
However, trends have major and minor highs and lows, and it is often not clear if something is major or minor. Traders are free to use the terms bear trend and bull trend in any way that they would like. No one will question your definition as long as the highs and lows are trending in a fairly obvious way.
The daily and weekly charts are probably in the early stages of bear trends. I said last week that there was at least a 50% chance of a 20% correction. That means a bear market. I suspect a bear market is more than 50% likely.
Furthermore, I said that there was a 30% chance of a 30% to 50% correction. That is still true. If there are consecutive closes below last week’s low, the probability will go up to at least 40%. Also, if there is a 40% to 50% correction, traders should assume that a decade-long trading range has begun.
Wednesday was weak Low 1 sell signal
The daily chart broke below Wednesday’s low. That triggered a Low 1 sell signal. But Wednesday was a bull bar and it was in a strong four-day rally. It is therefore a weak sell signal.
When that is the case, some bulls will scale in as the E-mini falls, expecting a rally back to above Wednesday’s low. That is what often happens when the sell signal bar is weak. Consequently, the bulls have a reasonable chance of a bounce-back up to Wednesday’s low this week if there is no bad Coronavirus news over the weekend.
However, traders believe that any rally will be a pullback in a bear trend or the start of a bull leg in a trading range and not the start of a bull trend. The bulls only have a 30% chance of getting a new high within the next few months.
Trading Room
Traders can see the end of the day bar-by-bar price action report by signing up for free at BrooksPriceAction.com. I talk about the detailed E-mini price action in real-time throughout the day in the BrooksPriceAction.com trading room. We offer a two-day free trial.


