
Few market watchers believe a low has been made as bear markets tend to produce several severe reversal rallies before finally setting a bottom, reports Marvin Appel.
U.S. stocks had their first back-to-back gains since February, including the spectacular rally on March 24 that was the largest one-day percentage gain (9.4% for the S&P 500) since 1933. That was followed by a gain of 1.2% on March 25, well off of the intra-day gain of almost 5%. The apparent cause for the rally is the approaching agreement on a $2 trillion federal stimulus package.
The Cboe Volatility Index (VIX) a measure of implied volatility using S&P 500 options remains above 60, off the highs above 80 but still at levels typical of 2008(See chart below).
It is unusual that during today’s market gains, VIX rose. Usually stocks and VIX move in opposite directions. This could mean that investors are aggressively hedging their equity holdings into the rally and is how the index is supposed to work. VIX is supposed to measure volatility and it is hard to argue that the violent upside moves this week signals lower volatility.
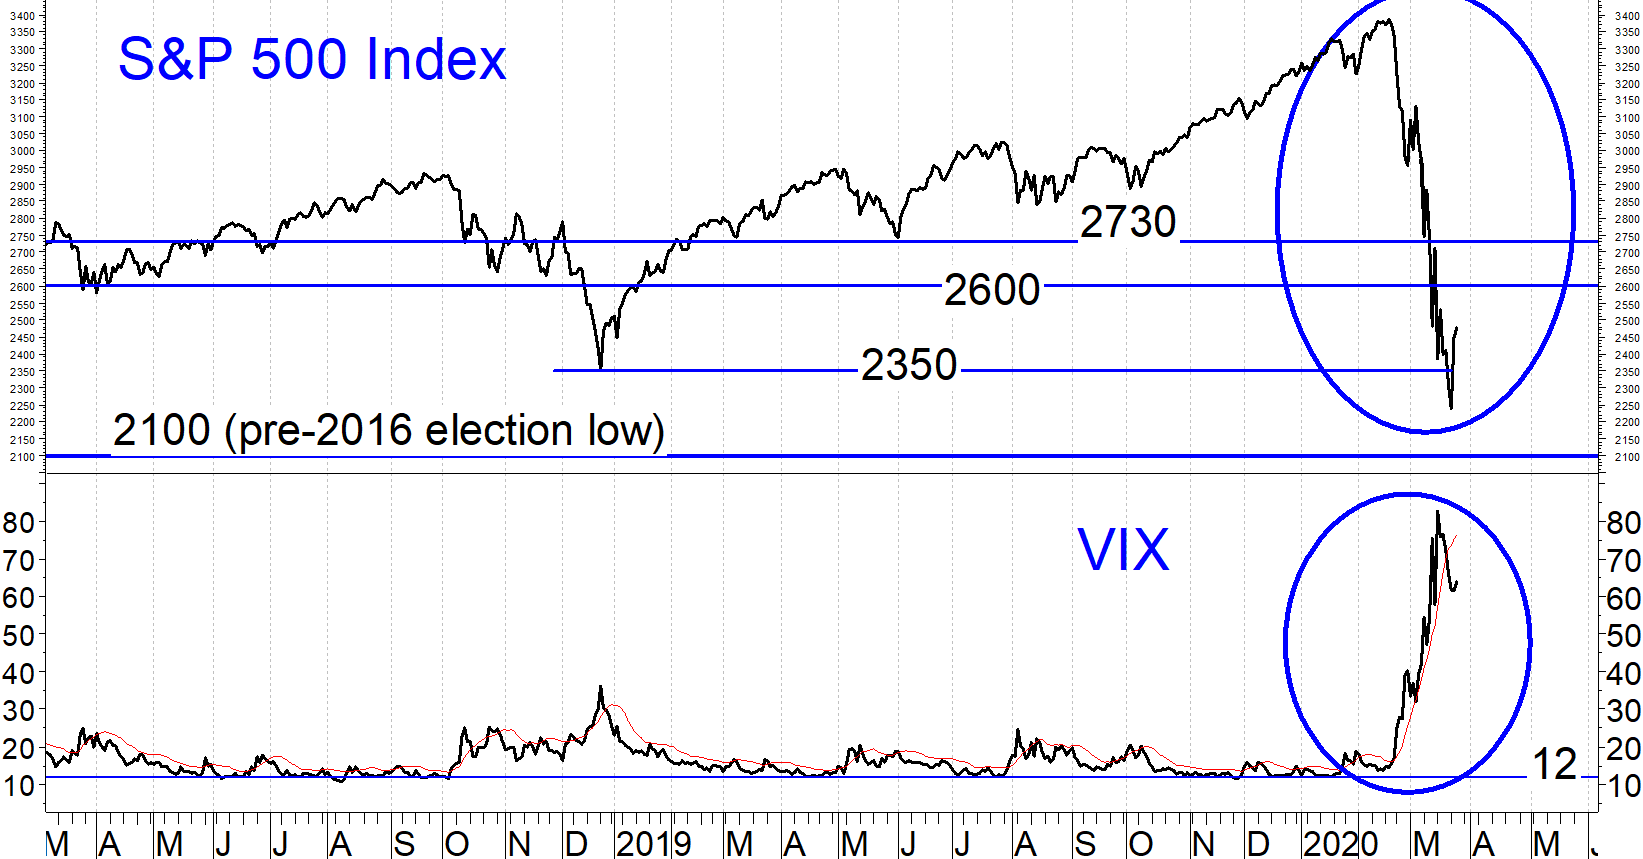
Figure: S&P 500 and VIX. The S&P 500 broke below its 2018 closing low, marking the fastest bear market in history. We could see a bear market rally back to 2600-2730, but this isn’t over yet.
If investors are aggressively hedging this would be, of course, a sign of skepticism that I share. It is hard to see the market turning on a dime the way it did after Dec. 24, 2018. The economic impact of this pandemic is unprecedented in the United States and world. The closest analogy I can perceive is 2008 in terms of the feeling of uncertainty and the magnitude of the potential economic disruption.
I was not nearly this pessimistic in the last issue two weeks ago. More likely, we will see impressive bear market rallies and several legs down in stocks, culminating in a 50% bear market. That would place a downside objective of 1600-1850 for the S&P 500 Index, some 30% below where we closed Wednesday (see chart).
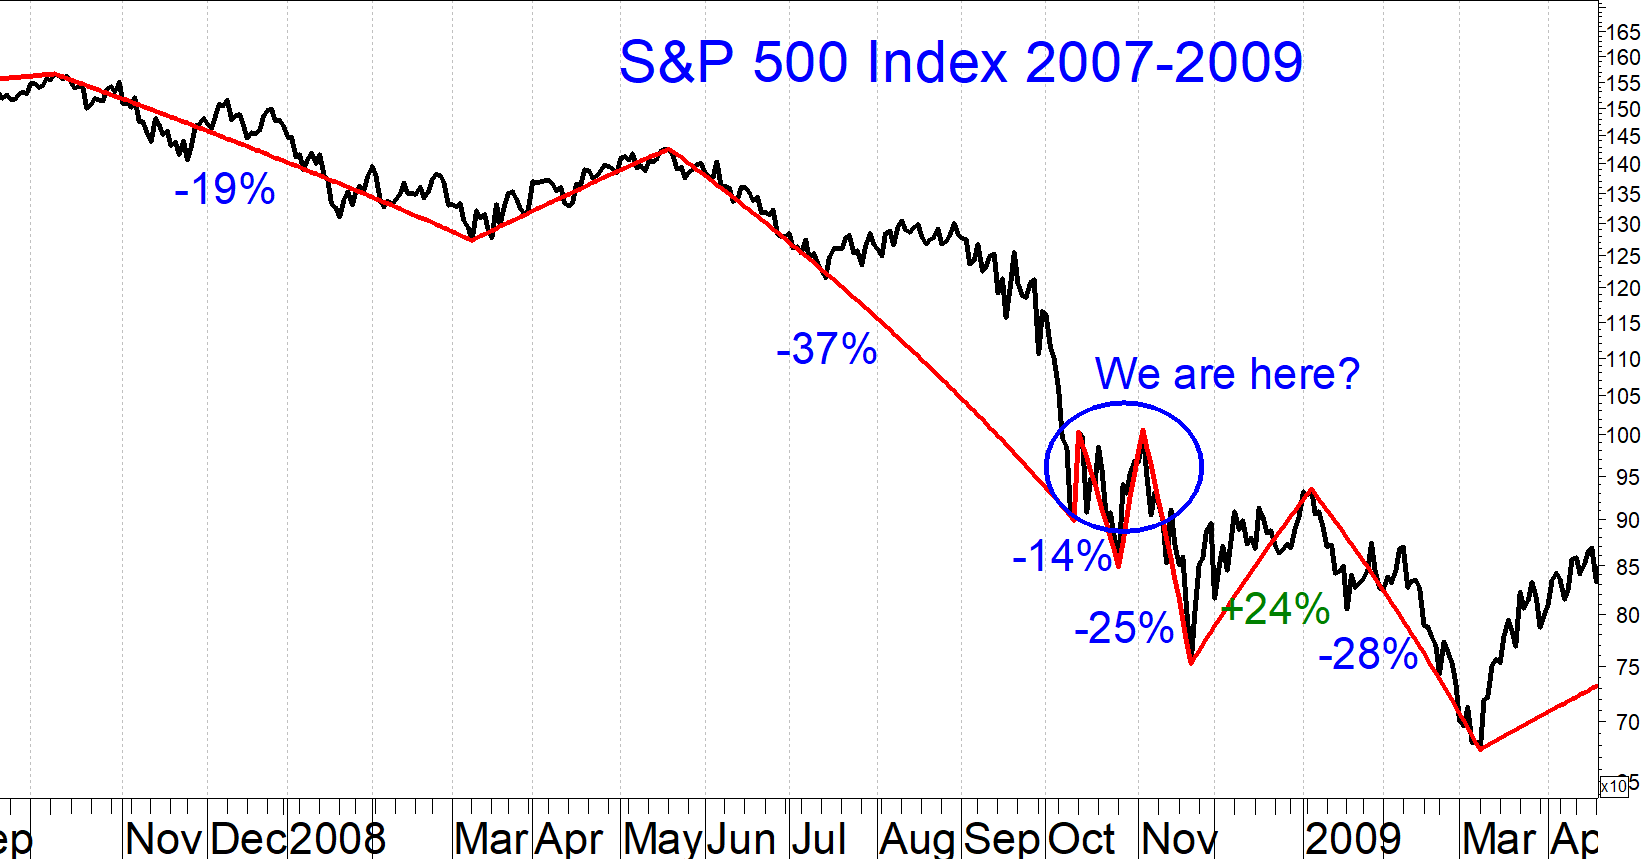
The chart above shows the multiple legs down that occurred in the 2007 to 2009 bear market, punctuated by rallies of at least 12% to 24% on four occasions. From the high in Oct. 2007 to the failure of Lehman Brothers in September 2008, the U.S. economy was drifting into recession. Things became unstable with the failure of Lehman Brothers. I view the current waterfall decline as analogous to the post-Lehman stock market; This time we didn’t have a building recession even though there were signs that the economy was decelerating as we entered 2020.
The implication of the analogy between the current bear market and the post-Lehman 2008 bear market is that it could take several months before the market hits bottom, and that bottom could be well below where we closed today.
The economic analogy tends to support this outlook. The 2008/09 recession was the deepest since the 1930s. Real GDP contracted by almost 4% over the space of six quarters (see chart below). The single worst quarter for U.S. GDP since WWII was the first quarter of 1958, when GDP fell more than 2.5% in three months, a 10% annualized rate of decline. The economy contracted 2.2% during the fourth quarter of 2008 at the height of the financial crisis.
In comparison, Goldman Sachs (GS) is predicting a second quarter decline of 6% in GDP (24% annualized rate) while JP Morgan is predicting a relatively moderate 3.5% decline (14% annualized rate). Either of these outcomes would rival or exceed the devastation of the 2008-2009 recession although, one hopes, the resolution would come more quickly than it did back then. These are not unreasonably alarmist projections. Tourism represents 2.6% of U.S. GDP. If that abruptly decreases by 80% due to the Coronavirus, that alone would knock 2.1% off of GDP in one quarter (8.4% annualized rate).
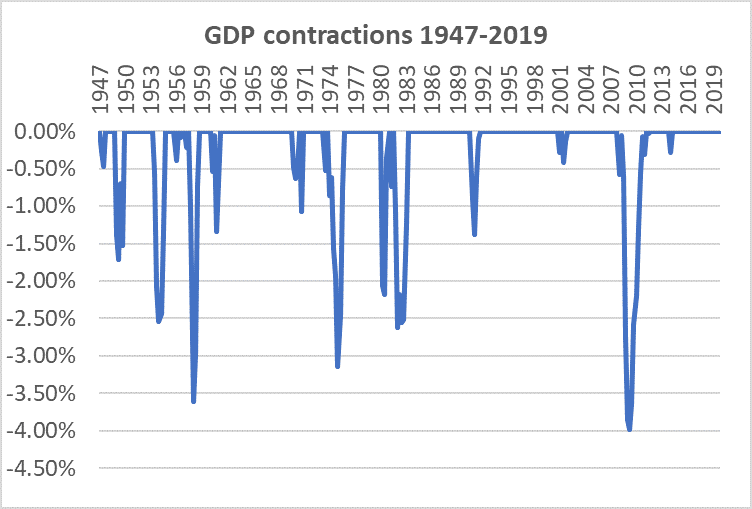
Figure: GDP contractions from peaks (drawdowns), inflation-adjusted. The 4% contraction in 2008-2009 brought unemployment above 10%. The coming recession is likely to be deeper, although perhaps shorter.
Source: St. Louis Federal Reserve
Implications
I view the current bear market as analogous to the decline that started with the failure of Lehman Brothers in September 2008. If that turns out to be a valid comparison, the outlook is for several more months of continuing market volatility with declines punctuated by bear market rallies before the ultimate low is in place.
Nobody can know what will transpire, but the risk of any decision will be high in an environment where intra-day moves of several percent are now commonplace. The best advice I can give is to take small steps when you place trades and be very wary of trying to catch the exact bottom. Don’t hold anything naked overnight. We will continue to use our models and judgment to trade for clients, but under current conditions we will do so with positions well below their full allocations.
Sign up here for a free three-month subscription to Dr. Marvin Appel’s Systems and Forecasts newsletter, published every other week with hotline access to the most current commentary. No further obligation.


