

While massive losses in stocks are disturbing, they aren’t unexpected, however the bond market appears to be failing as a safe-haven, which is troublesome, reports Marvin Appel.
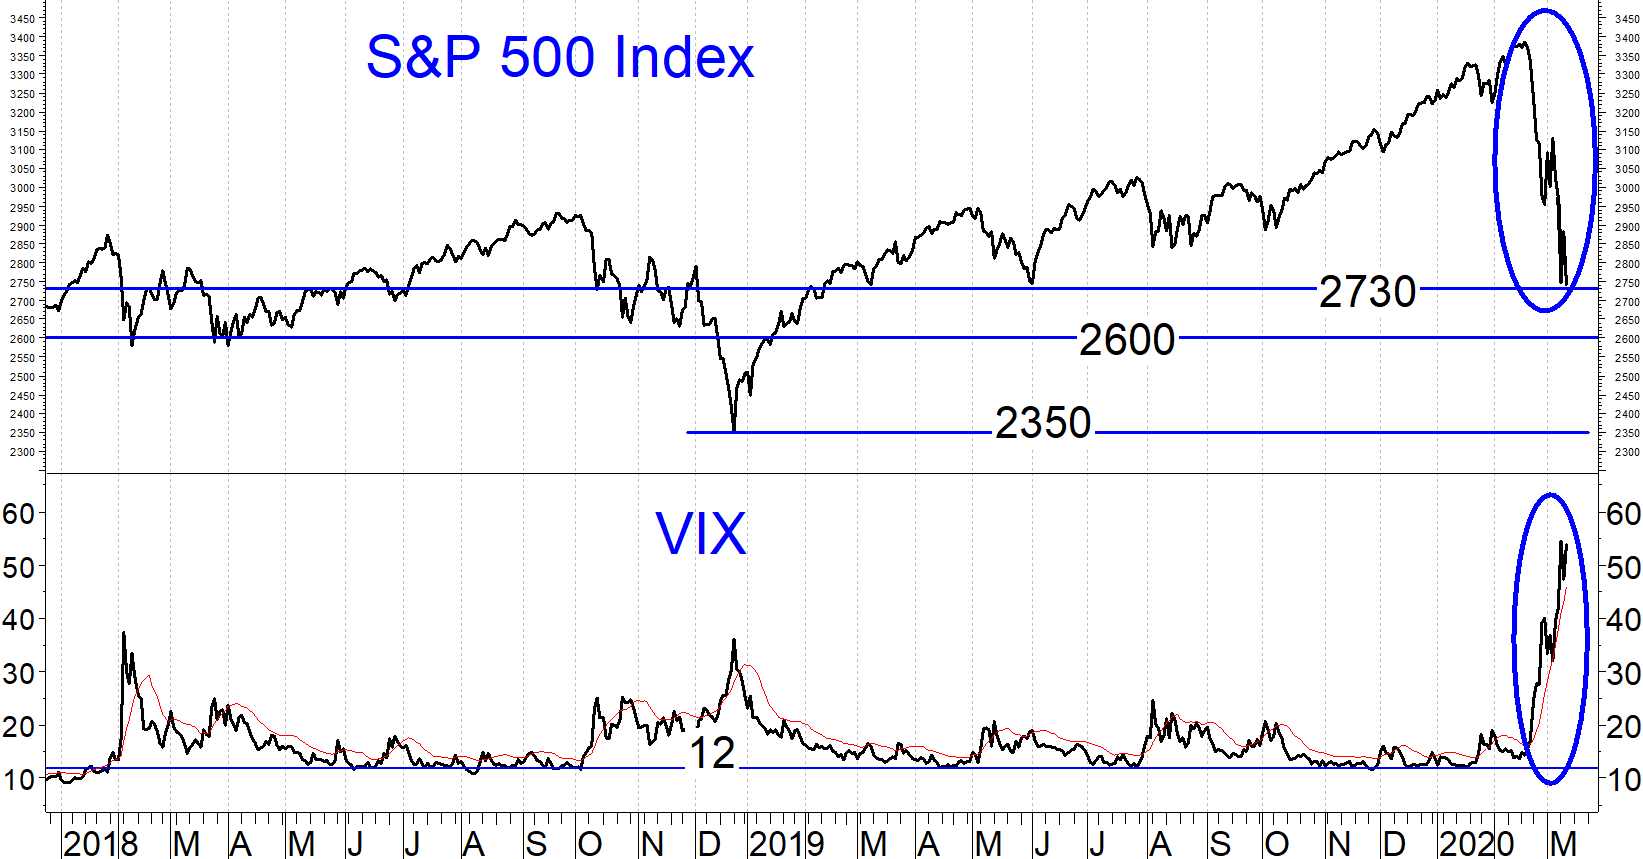
Coronavirus fears and a crude oil price war between Russia and Saudi Arabia sparked a 7.6% decline in the S&P 500 Index on March 9. After a nearly 5% bounce on March 10 the index retested that low on March 11 and had it worst day of the year on Thursday, dropping 9.5%. Option implied volatility as measured by the Cboe Volatility Index (VIX), has closed above 50% on Wednesday and above 70 on Thursday, This is the highest since 2009, more than two and a half times the long term average, and four times what has been typical in the past three years. (See chart below).
The most worrisome action on Wednesday came from the Treasury complex and bond exchange traded funds. The typical pattern in recent years has been for investment-grade bond yields to fall (that is, bond prices rise) on days of big stock market declines as traders fled to the safe haven of bonds. On March 11, however, the iShares Investment Grade Corporate Bond ETF (LQD) lost 3.3%, more than junk bond ETFs iShares iBoxx $ High Yield Corporate Bond ETF (HYG) and SPDR Bloomberg Barclays High Yield Bond ETF (JNK) and almost as much as the 4.9% decline in the S&P 500 Index. The broader investment-grade bond market ETF iShares Core US Aggregate Bond ETF (AGG) fell 1.4% and even Treasury notes slipped as the iShares 7-10 Year Treasury Bond ETF (IEF) dropped a half of a percent. Bonds are apparently no longer a safe haven.
I see two potential explanations. First, this could be a liquidity-driven event representing a short-term imbalance between sellers of bonds desperate to raise cash relative to those who want to add to bond holdings. In that case, Federal Reserve intervention could calm things down.
However, a more sinister possibility is that the bond market is pricing in a recession and runaway deficit spending, finally awakening to the risks that have been building for years in the investment-grade bond market. Much has been written in recent years about the huge overhang of marginally-investment-grade BBB-rated debt at risk for a downgrade to junk bond status.
BBB-rated debt represents slightly more than half of the U.S. investment-grade corporate bond market, and the $3 trillion in outstanding BBB debt is more than twice the $1.2 trillion in U.S. high yield bonds. The threat of a recession means that massive amounts of formerly investment-grade debt could be converted to junk bonds, requiring many institutional holders to sell as their investment policies restrict exposure to junk bonds.
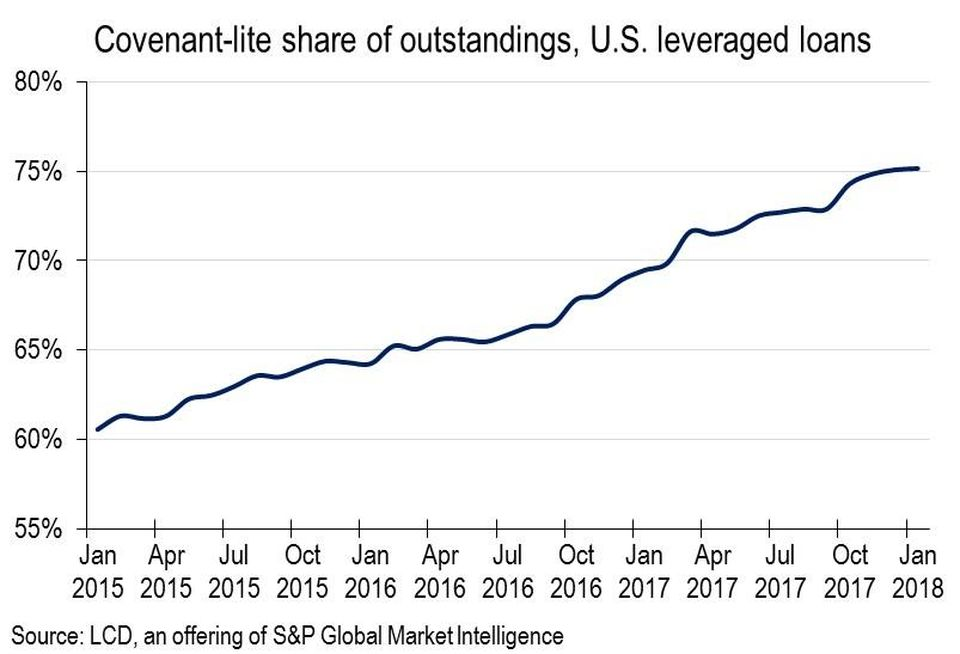
Floating rate loans face an additional hurdle. Floating rate loans are originated by banks and then securitized. Traditionally, banks demanded lender protections called covenants that limited the banks’ risks and helped increase borrowers’ recoveries in the event of a default. However, the demand for yield over the past five years gave borrowers more leverage (pun intended) to demand easier terms. As a result, almost all floating rate loans now outstanding are covenant-light, without the usual lender protections (see chart below).
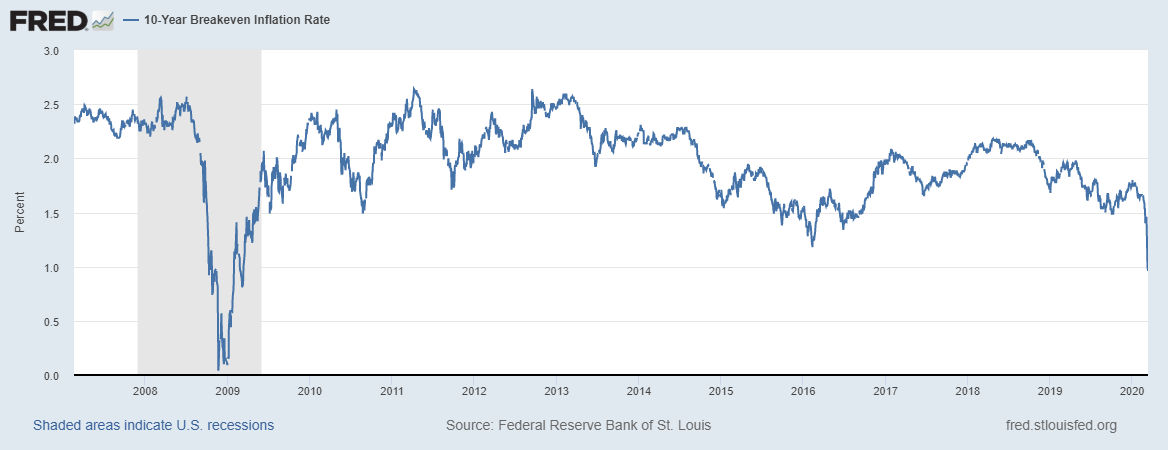
The Treasury market is showing the most economic pessimism since 2009. Specifically, the inflation rate that must occur over the next 10 years to generate the same return from 10-year Treasury inflation-protected securities (TIPS) and 10-year regular Treasury notes is down below 1% (see chart below). Actual 10-year inflation hasn’t been that low at any time in the past 60 years, so that today’s bond prices reflect a very bleak economic outlook.
Now that a recession may be at hand, this will be a case of Warren Buffett’s saying that it is only when the tide goes out that you learn who has been swimming naked.
As Joon Choi discusses in his article the nearly 8% loss in an investment-grade corporate bond, LQD, over the past three days is reminiscent of 2008. During the financial crisis the Vanguard Short-Term Investment Grade Bond Fund (VFSTX) had a drawdown of 8% and their Intermediate-Term Investment Grade Bond Fund (VFICX) had a 14% drawdown. The broader Vanguard Total Bond Market Index Fund (VBMFX) had a worst drawdown of 5.4% in 2008 while the corresponding AGG overshot a bit and suffered a 7.2% drawdown that year.
Implications for bonds
While I do not expect a repeat of the severe economic and financial events of 2008, my impression from the bond market’s behavior now is that a recession has just begun and that as a result, we will see a shake-out in the corporate bond and floating rate loan market.
Even investment-grade corporate bonds are at risk, as in 2008, and intermediate-to-long term Treasury debt has limited upside (since yields can go only so far down but have room to rise significantly). As a result, cash is king. We are using government money market funds for our clients’ cash balances.
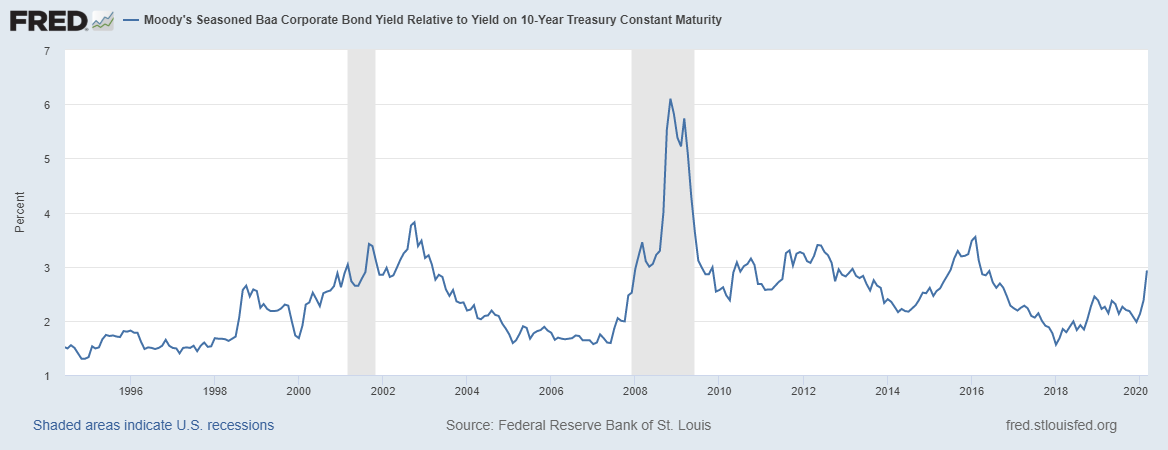
The silver lining is that the market is setting up potentially excellent buying opportunities in corporate bonds, both high yield and investment-grade. Spreads between Treasuries and both investment-grade and high yield corporate bonds have reached levels not seen since 2016, which was an excellent buying opportunity for spread product such as the Baa-Treasury spread and the high yield spread (see charts below).
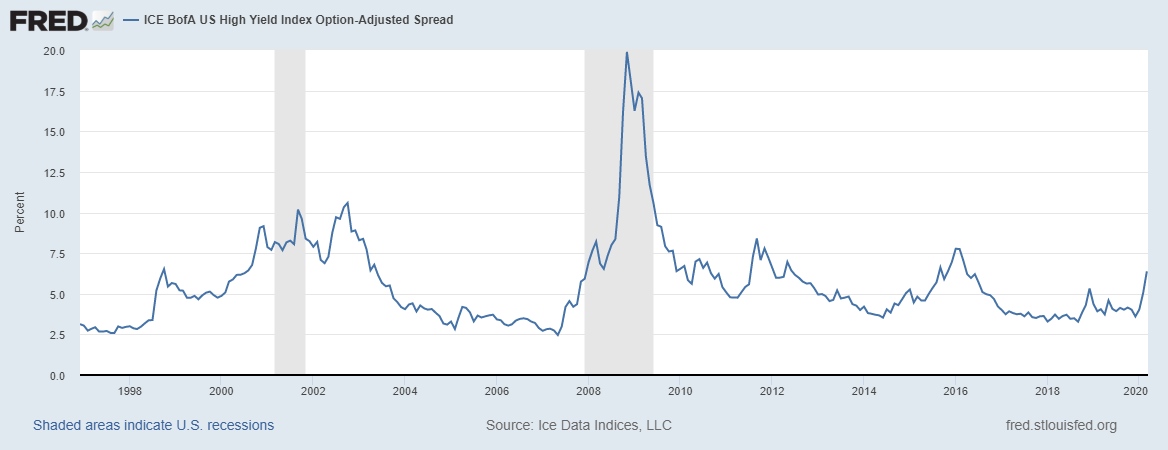
The higher the spread, the greater the opportunity. However, rather than catching a falling knife we use trend-following indicators to time the purchase of such bonds after the potential peak in spreads. I expect it will be several months before the markets stabilize. Until then we will wait patiently in cash.
Implications for equities
The average market decline around a recession has been 27% over a period of 13.5 months. After the March 11 decline we could be more than halfway to the ultimate bottom, although I consider it more likely that the market will throw us some head fakes in the form of bear market rallies before the final low is in place months down the road.
The S&P 500 chart above indicates what will likely be important support levels. The first couple support areas; the 2730, May 2019 low and the 2600 March-April 2018 low were obliterated on Thursday’s close, leaving only the December 2018 low of 2350, which likely will be tested before this bear market is over—or perhaps before you read this, if we have another wild overnight trade!
Sign up here for a free three-month subscription to Dr. Marvin Appel’s Systems and Forecasts newsletter, published every other week with hotline access to the most current commentary. No further obligation.


