
The Coronavirus pandemic helped created a big video game surge as consumers stay at home during quarantine time. Many technology suppliers, video publishers, and E sports stocks have seen a good boost in their stock performances. As video games may continue to consume a major portion of consumers' time, their stocks are showing some bullish patterns and presenting trading opportunities.
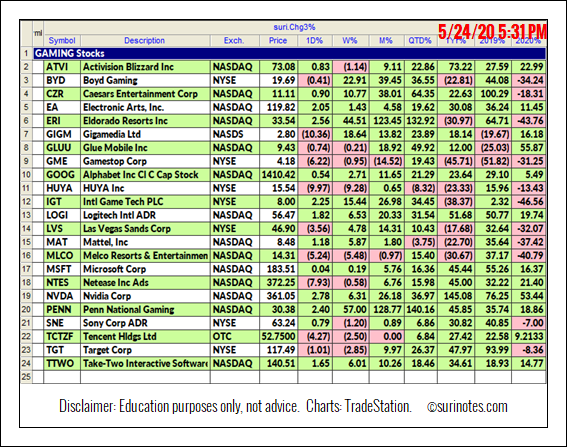
Here is a list of Gaming Stocks and their performances in the year 2020.
V Chart Patterns
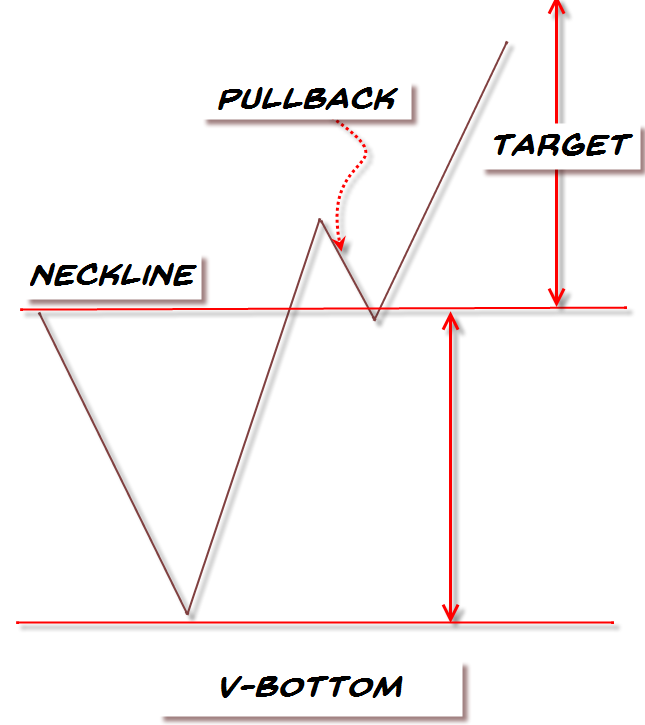
As the name implies, the "V" chart patterns have the letter "V" shape and prices shift their momentum from an aggressive sell-off to aggressive rally in its structure. It is relatively a rare pattern with extreme angles and maybe not easy to recognize until it is mostly formed. The V-Pattern is a powerful reversal pattern seen in all markets, all time-frames and in all instruments. The "V" pattern consists of rapid price action and may not be suited for all casual investors. The "V" patterns are formed when its trend is sharply switched from bearish to bullish (in case of V-Bottom) or bullish (or sideways) to bearish (in case of V-Top patterns).
Trading V-Patterns
The critical aspect of the V pattern is it must have a sharp downtrend followed by a quick and sharp uptrend reversal. Look for a one- to three-bar reversals at the bottom of the pattern to signify the sharp reversal process. The volume increases during both the phases of the breakdown (down-shift momentum) and breakout (up-shift momentum). There are a few ways to trade this pattern, but the most conservative way is to trade a long entry once the pattern is complete and retraced back to the neckline (as a pullback). Aggressive traders may enter on the trendline breakouts at the bottom, but the success rate with simple trendline breakouts is low (52%) compared to the neckline breakout (64%) reaching its first target at 62% of its size from breakout level.
Key factors to identify the pattern:
1. Sharp Downtrend
2. Sharp Uptrend
3. V shaped Pattern (usually 1-3 bars reversals)
4. Volume increase in both breakdown and breakout phases
5. Breakout over neckline
6. Pullback to the Neckline
7. Target
Here is a diagram of the "V" bottom pattern
V-Pattern Examples
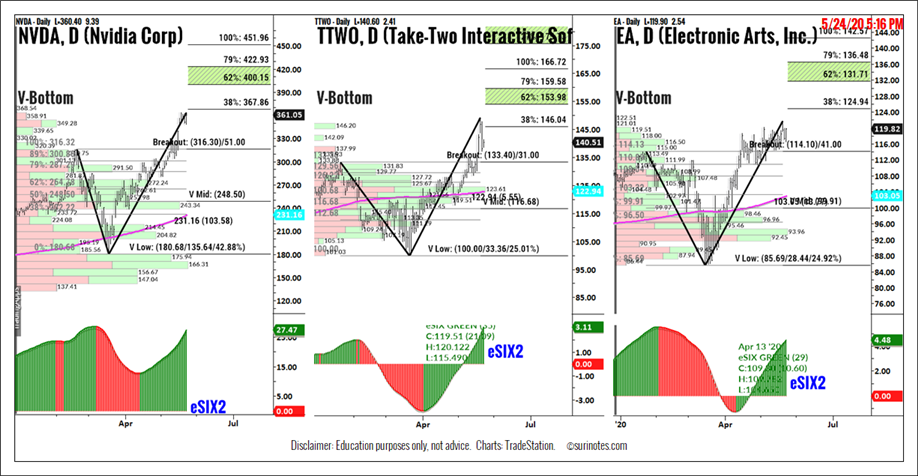
The following charts show V-Bottom pattern formations.
Nvidia Corp. (NVDA) shows a V-pattern formation from the end of January 2020 to May 2020 as the price dropped from a high of $316.30 to a low of $180. The current breakout level is $316.30. Currently, the underlying bullish trend has confirmed the breakout and V-pattern targets are set at $400-423, $451.
Take Two Interactive (TTWO) shows a V-pattern formation from the end of January 2020 to May 2020 and shows a similar breakout like NVDA as it trades above breakout level and confirmed by underlying bullish trend. V-pattern targets are set at $154-$160.
Electronic Arts, Inc. (EA) shows a V-pattern formation from the end of January 2020 to May 2020 as the price dropped from a high of $114.10 to a low of $85.69. EA is trading above the breakout level ($114.10) with the support underlying bullish trend. V-pattern targets are set at $131-136, $142.
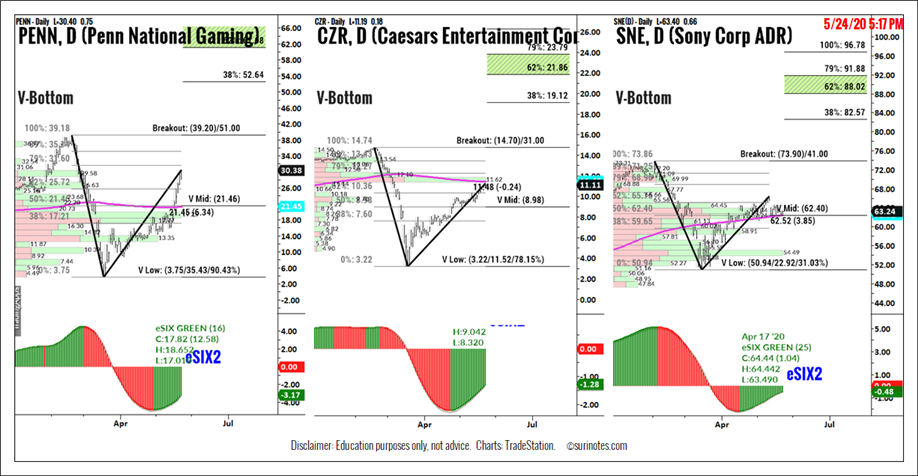
The following charts show Gaming Stocks V-pattern formations: Penn National Gaming (PENN), Caesars Entertainment Co. (CZR) and Sony Corp. (SNE). These patterns need to close above Breakout levels to produce trades. This means there may not be a signal, but you will be able to exploit it when/if it occurs.
Each chart shows its breakout levels and potential target levels.
Find more of Suri’s work at surinotes.com.


