The banking sector has been one of the worst performers in 2020, but several bank stocks have bullish chart patterns ready to hit, reports Suri Duddella.
The Banking and Financial sectors are the barometer of any country's economy. Investors look for a strong financial and banking sector for a stable and healthy economy.
After performing well in 2019, banks have underperformed the broad S&P 500 and a few key sectors in 2020. This could be due to the Coronavirus pandemic and weakened economy.
Some of these banking sector stocks are currently forming potential reversal ABC Bullish chart patterns and could present great trading opportunities on any positive news. This article discusses some of the chart patterns and how to trade them.
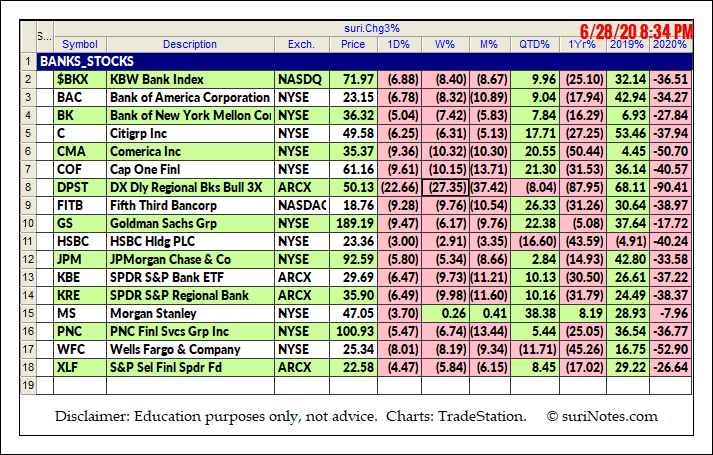
Below is a list of Banks Stocks and their performances in 2019 and 2020.
Trading ABC Patterns
The ABC Chart pattern and its related AB=CD Chart Pattern are prime examples of "Symmetry" in the markets. These "Harmonic" patterns help traders to identify buying and selling opportunities in all markets and in all time-frames. The ABC and AB=CD patterns are first described by H.M. Gartley in his book "Profits in the Stock Market." The main advantages of trading harmonic patterns are that they allow traders to determine risk vs. reward ratios beforehand as they forecast key market turning points and profit targets for traders. The ABC pattern can be a continuous or reversal pattern and is shaped like a lightning bolt.
Identification
The following chart show ABC Bullish pattern formation and its trade information in TradeStation software.
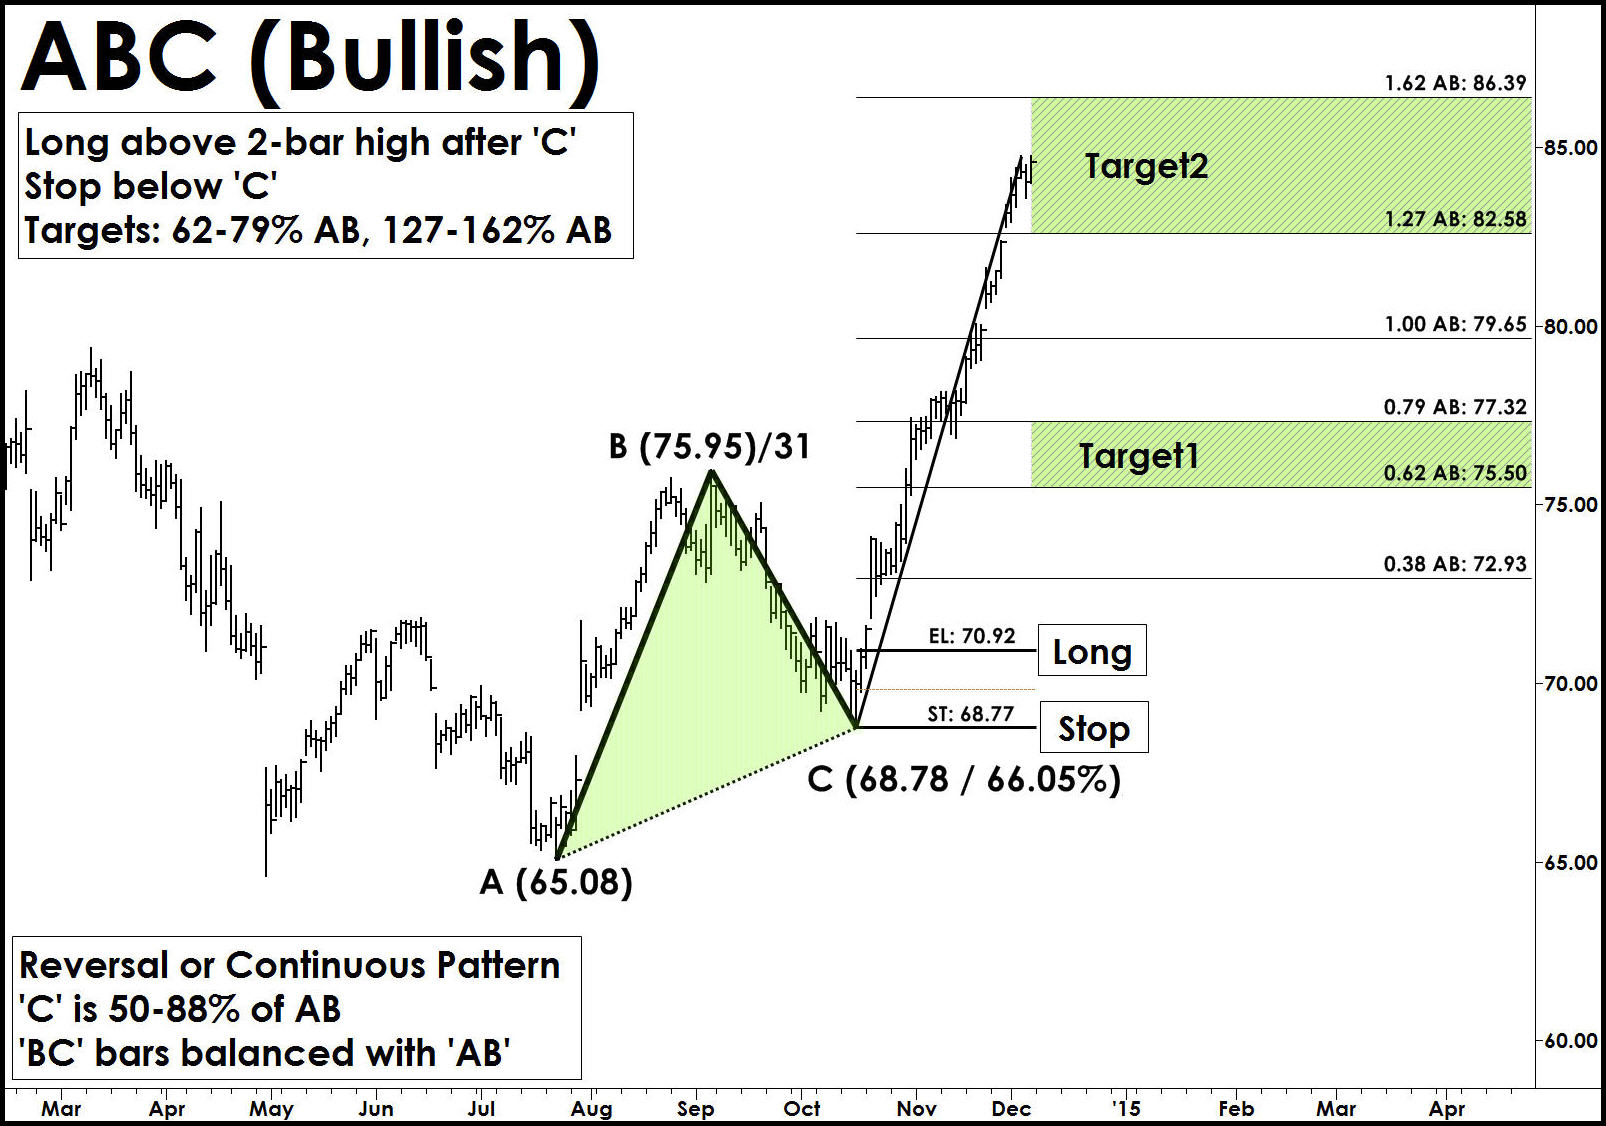
Trade Entry: After ABC pattern is completed, it is advisable to wait for the pattern to confirm a reversal signal using any momentum based indicator or price confirmation mechanisms. Enter after a long trade above the Entry Level ('EL').
Stop: A Stop is placed few ticks below C (in Bullish) or few ticks above C (in Bearish) levels.
Targets: The ABC Pattern targets are computed using the AB and BC swings. The height pattern (AB) is used to project target levels from C-level using Fibonacci ratios. The first target zone is (62% AB) from 'C' and second target zone is (127% AB). A secondary target level is set at 100% AB Level.
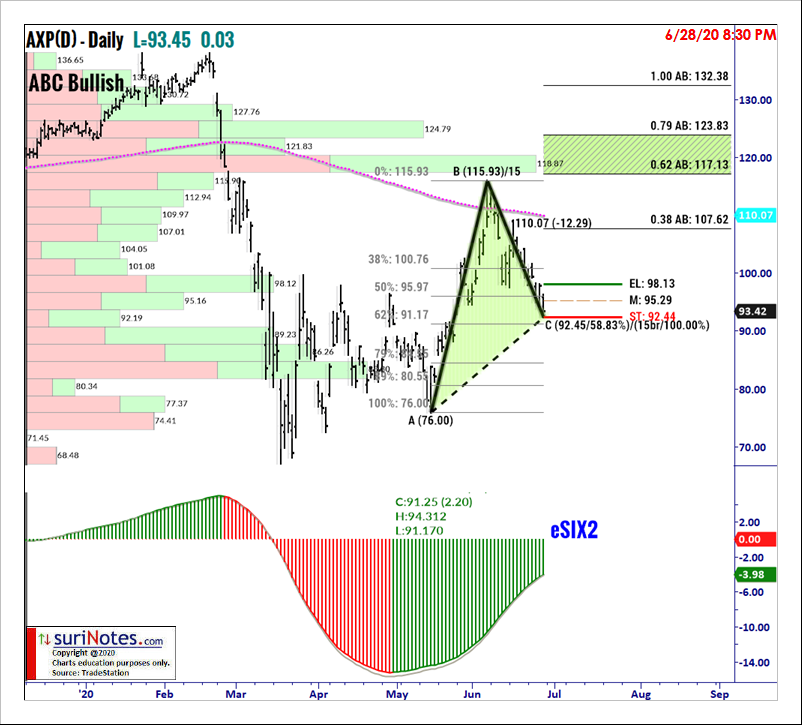
American Express ABC Bullish Pattern
American Express (AXP) is forming an ABC Bullish Pattern on its daily chart and is trading below its long entry-level $98.13 (see below). If price trades above $98.13, a long trade may be entered with a stop below $92.44. Profits targets are set at $117.10 and $123.80.
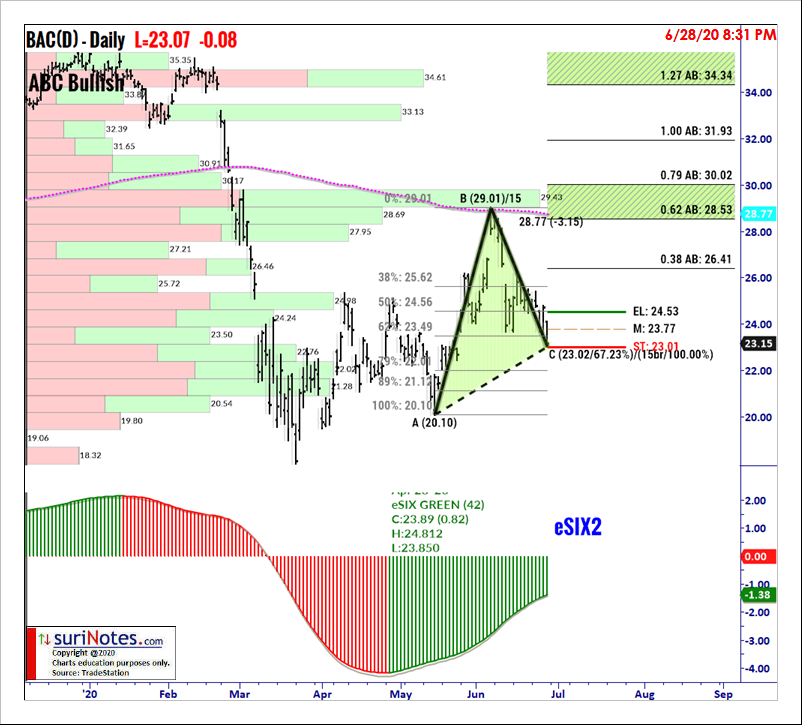
Bank of America ABC Bullish Pattern
Bank of America (BAC) is forming an ABC Bullish Pattern on its daily chart and is trading below its long entry-level $24.53 (see below). If price trades above $24.53, a long trade is signaled with a stop $23 and targets at $28.50 and $30.
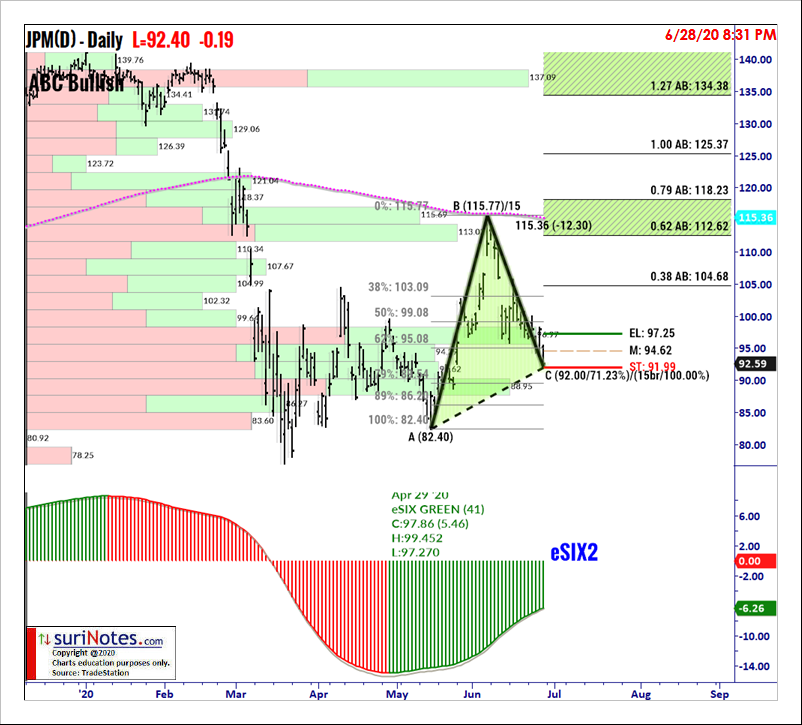
JPM ABC Bullish Pattern
JPMorgan (JPM) is forming an ABC Bullish Pattern on its daily chart and is currently trading below its long entry-level $97.25. If price trades back above $97.25, a long trade is signaled and may be entered with a stop below $91.99 and profit targets at $112.60 and $118.20.
Watch Suri’s archived presentation “How to Trade Chart Patterns With Market Context,” from Friday June 12 as part of the New MoneyShow Virtual Event. Find more of Suri’s work at surinotes.com.