
While S&P Looks to Test 2700, Sell Signal is Weak and May only produce minor initial sell-off, reports Al Brooks.
The E-mini S&P 500 rallied strongly last week to end as an outside up week, but is still in its month-long trading range. There is still a 50% chance of a selloff to below 2700 before the E-mini makes a new high.
The monthly E-mini S&P 500 futures chart has rallied strongly for three months (see below). It is now just below the all-time high.
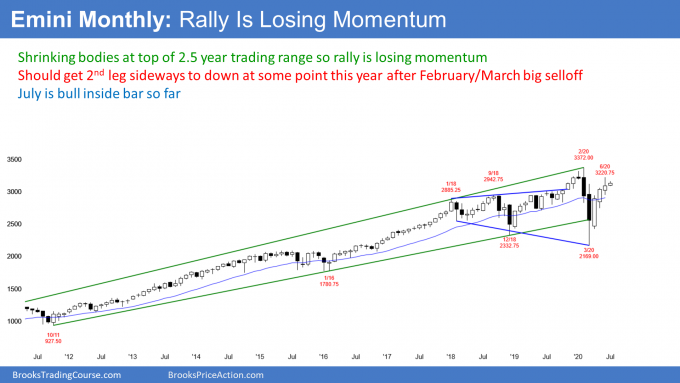
However, it is also near the top of a 2.5-year trading range. Moreover, the candle bodies have been shrinking. That is a sign that the rally is losing momentum. The big tails in June make it almost a neutral month.
The bulls can argue that the three-month rally is strong and therefore the E-mini should go higher, but the bears see the rally losing momentum at the resistance at the top of the range.
There is still room before it hits the resistance level of the February high and the momentum continues to be up. Consequently, the bulls continue to have a 50% chance of a test of the old high within the next month or two.
If July trades below the June low, the bears will see a lower high double top with the February high. However, June had a bull body. That is a weak sell signal bar. In addition, there are three consecutive bull bars. That is bad context for a reversal.
Therefore, if July trades below the June low, the sell signal will be weak. The best the bears can probably get is a one- to two-month pullback to the middle of the 2.5-year trading range.
Strength usually leads to more strength
CNBC has an interesting article that compares the current market to prior markets. The three-month rally was exceptionally strong, up 20%. There have been nine other times since World War II when the market rallied 15% or more in a quarter. In every instance, the market was higher at the end of the next quarter. The average gain was 9%.
Also, Ned Davis Research notes on May 26, 90% of stocks in the S&P 500 were above their 50-day moving averages. That has happened 19 times since 1967 and the market was up one year later in every instance. The average gain was 17%.
While traders don’t like to fight the tape, there are always countless variables that can affect these results. It is impossible to know if the current variables are significant enough to make traders question these statistics.
For example, how many of the quarterly rallies came from a crash, and how many ended just below the top of a trading range? If you were to only look at prior times that included these two additional variables, the sample size would shrink considerably. It might even become so small to eliminate the expected benefit.
There is one other historical trend that is important. When an incumbent president loses re-election, the stock market on average sells off a little in September and October. Since most pundits believe President Trump will lose, that increases the chance of a pullback before Nov. 3.
Things like this are entertaining, but not tradable. Traders trade what is in front of them, even though they might give some consideration to historical tendencies. If the market is selling off while a study says it should be going up, smart traders will sell and ignore the research.
The weekly E-mini S&P 500 chart formed an outside up bar last week (see below). The week traded below the previous week’s low and then above its high. This is a sign of strong bulls, especially when it is in a strong bull trend.
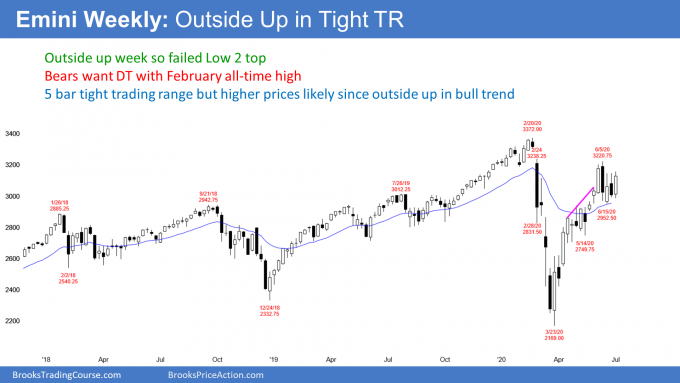
However, the week did not close above the previous week’s high. Therefore, the bulls were not as strong as they could have been. Traders would have seen the week as much more bullish if the week closed on its high and far above the previous week’s high.
The previous week produced a bear bar and a sell signal bar for a Low 2 top. When last week traded below it, a sell signal was triggered.
But there were more traders looking to buy the sell signal than to sell it. The E-mini immediately reversed up and rallied all week.
Tight trading range so expect reversals
It is especially relevant that the weekly chart has been sideways for five weeks. When you look at the five candlesticks, each week was a strong candlestick that was in the opposite direction of the prior week (bull, bear, bull, bear, bull). Therefore, a big trend bar is not as meaningful as a similar bar that is not within a tight trading range.
Don’t get too excited with there is a big trend bar in a tight trading range. It has less predictive power than what you might think. Until there is a breakout, there is no breakout.
The importance of the big gap down in February
A failed sell signal in a strong bull trend typically means that the market has to go higher to find more sellers. I have talked about the gap above the Feb. 24 high many times. Gaps on the weekly chart are rare. That gap was huge and it was the start of the pandemic crash. It therefore is important and a strong magnet.
I have been saying that the biggest problem with any reversal down over the past month is that many traders are unwilling to sell until after they see a test into that gap. Alternatively, they will sell if there is a strong reversal down. If the E-mini trades into the gap, traders will then wonder if the rally will make a new all-time high.
There is currently a 50% chance that the rally will enter the gap before reversing down to the middle of the 2.5-year trading range. If it does, there will be a 50% chance of a new all-time high before a reversal down.
What about the bears?
There is always a bear case. The E-mini has been in a trading range for 2.5 years. That means that reversals are more likely than a successful breakout. Remember, the February high led to a reversal down from above the range. Also, the March low reversed up from the below the bottom of the range. When any market is within a trading range, nothing is as bullish or bearish as it might appear.
The bears had a good chance of beginning a reversal down last week, but they failed. They will try again over the next few weeks. For example, if the E-mini enters the gap, the bears will try to have the breakout above the Feb. 24 high fail. If they can create a big bear bar closing near its low, traders will look to sell a reversal down from the gap.
They can even create a sell signal this week. If this week goes above last week’s high, but reverses down and closes on its low, traders will again look to sell.
Alternatively, what happens if this week fails to break above last week’s high? Suppose that this week is a bear inside bar closing on its low. There would then be an Inside-Outside-Inside (IOI) Breakout Mode pattern. If the bar closed near its low, it would be a credible sell signal bar. Traders would be prepared for a reversal down.
The Fed is promising protection
I have said many times that the Federal Reserve emphatically made the point that they will “print infinite money” to protect the economy. Nothing else matters. Bad earnings, high unemployment, reduced consumer spending, the possibility of Joe Biden winning, the possibility of President Trump winning, the chance that the Democrats will win the Senate, who cares? Investors believe that the Fed will buy anything, including exchange traded funds, to prevent a dangerous selloff. Therefore, the Fed is essentially providing a put for anyone who owns stock. They are promising that the downside is not dangerous.
It is important to note that they allowed a 35% selloff in March. I suspect that they will allow a 50% pullback at some point within the next couple years. But traders believe that the Fed will buy aggressively at some unknown level. Therefore, if a trader buys at the high and the market falls 50%, they can buy more, expecting a big enough Fed bounce to allow them to exit their position at their average entry price and avoid a substantial loss.
Investors think they are trading risk free so why not buy, even at the high? Either the E-mini continues up and you make a profit; or, it goes down, you buy more, and then make a profit.
But complacency can be expensive. Many traders think they will buy more if the E-mini drops 20%. But when it does, they might get scared and instead exit with a huge loss.
How low can the E-mini go?
Given that the Fed has guaranteed that it will protect the economy, traders are confident that the protection will include the stock market.
However, the Fed will not bother to stop a 2% selloff. What about a 15% selloff? No one knows when they will come in. There are many factors involved, including the rate of the selloff and the reason behind it.
Also, there is the extra protection that comes ahead of the election. The Fed does not want to do anything that will make traders believe they are trying to influence the election in either direction. That means their best course is to keep their promise that they will protect the economy.
This significantly reduces the chance of another crash ahead of the election. This is true even though there are sometimes big selloffs in the August through October window.
However, the E-mini has been in a trading range for 2.5 years. Experienced traders expect occasional pullbacks to the middle of the range. That middle is around 2700, which would be about a 15% correction. It could be a little more or less, but the 2600 to 2700 area is probably the lowest the E-mini can go until after the election. The wildcard is how affective can Fed intervention remain, the longer they are involved in clearly trying to prop up the markets.
The daily E-mini chart has been sideways for a month (see below). However, last week’s reversal up was strong. It came from a higher low, and there was both a strong buy signal bar and a strong entry bar. The reversal up was enough to make traders believe that the E-mini will break above the trading range this week.
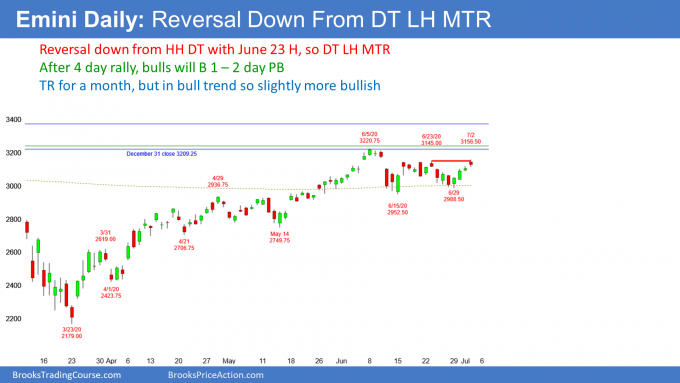
The next target is the June high and then the gap above the Feb. 24 high (seen on the weekly chart). If the bulls can get a strong rally up to the gap, the rally will probably continue to a new high.
As long as the E-mini is in its month-long range, the probability of either a bull or bear breakout cannot be more than 55%. And that probability changes with each day’s price action. It is currently slightly more bullish, but a couple down days will shift the odds in favor of the bears again. Traders believe that there is about a 50% chance of a selloff to 2700 before there is a new high.
Can the E-mini reverse down from here?
It is important to note that while Thursday broke above the June 23 top of the range, it did not break far above. Also, it did not close above the trading range. Consequently, the bears still have almost a 50% chance of getting a reversal down from a double top with the June 23 high.
This is a double top lower high major trend reversal (the second high in the double top is slightly higher). A major trend reversal has a 40% chance of leading to an actual reversal of the trend and not just a small leg down (a minor reversal).
Thursday is a sell signal bar. But there was a prominent tail below the bar. Also, the bear body was small and it followed a strong three-day rally. Consequently, if Monday falls below Thursday’s low to trigger the double top sell signal, the selloff will probably only last a day or two.
The bulls would likely try at least once more to break above the top of the month-long range. Therefore, a selloff on Monday will more likely be a pullback from last week’s rally than a trend reversal down from the double top.
But, if the reversal down comes from a big bear bar or two or three smaller bear bars, the probability will again favor the bears. Because the E-mini has been in a trading range for 2.5 years, traders expect a pullback to the middle of the range at some point.
It can begin at any time. And that includes from above the all-time high. There are often brief breakouts of a range before there is a reversal.
It is important to remember that surprisingly strong selloffs tend to occur in August through October. I have talked many times about the magnets below between 2600 – 2700. If the E-mini breaks strongly below the June low, it will probably reach those targets before testing the all-time high.
Trading Room
Traders can see the end of the day bar-by-bar price action report by signing up for free at BrooksPriceAction.com. I talk about the detailed E-mini price action real-time throughout the day in the BrooksPriceAction.com trading room. We offer a two-day free trial.


