
The E-mini is ready to breakout/breakdown, but bulls may want to test high first, reports Al Brooks
The E-mini S&P 500 is in breakout mode entering a seasonally bullish time of year. But it formed a strong sell signal bar on its weekly chart. If the bears get a big selloff this week, the E-mini will probably work down below 2700 this summer.
The monthly E-mini S&P 500 futures chart has been in a trading range for 2.5 years. The E-mini has rallied for three months, but the candle bodies have been shrinking (see monthly chart below). This represents a loss of momentum as the rally approaches the resistance at the top of the range.
When a market is in a trading range, traders expect reversals near the top and bottom. The E-mini is now near the top. Traders are looking for a pullback to the middle of the range.
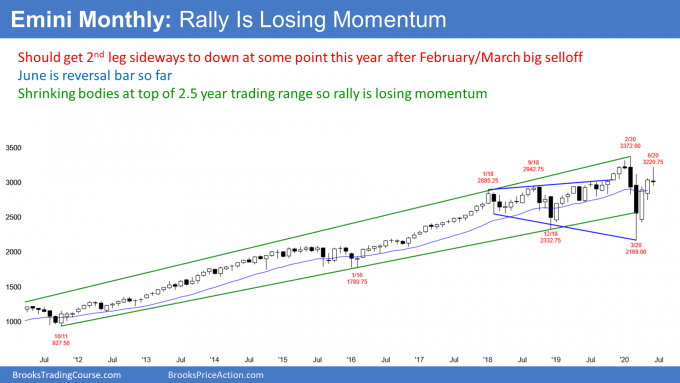
If June closes below the open of the month on Tuesday, it will have a bear body. It would then be a bear sell signal bar for July. That would make lower prices likely in July.
But the three-month rally was surprisingly strong. Consequently, traders will look to buy in the middle of the range after a one- to two-month pullback. They do not believe that a reversal from here will continue to below the March low.
End of month & end of quarter
Remember, there are still two trading days remaining in June. The June candlestick could look very different once it closes.
It is important to note that there is a bullish tendency at the end of quarters and ahead of holidays. Both of these factors are in effect at the end of June.
If June were to rally in the final two days and close above the midpoint of the month, that would increase the chance of higher prices in July. More traders would suspect that the rally will continue up to a new all-time high.
There is another important consideration. Most institutions have huge profits this quarter. Many will want to take some profits before the end of the quarter. If enough do, the E-mini could fall dramatically in the final two trading days.
The weekly E-mini chart has been sideways for four weeks (see chart below). This follows a strong three-month rally is in a tight bull channel.
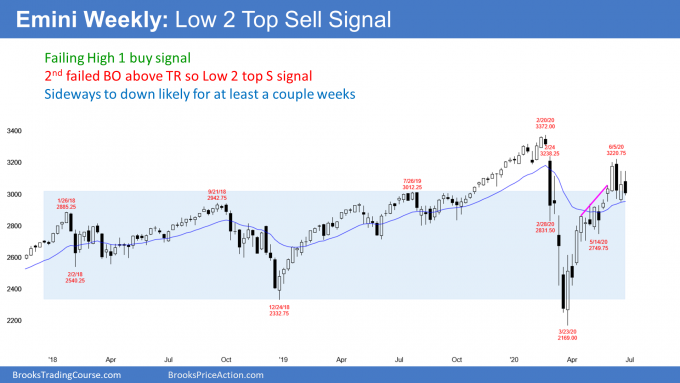
Many bars over the past 10 weeks have had prominent tails. That is trading range price action. Typically, this leads to a trading range. The past four weeks of sideways trading might be the start of the trading range. Traders need more information before they conclude that the three-month bull leg has ended, and a bear leg has begun.
There have been two legs up in the three-month rally. Last week went above the previous week’s high and triggered a High 1 bull flag buy signal. But instead of continuing up for a third leg, the E-mini immediately reversed down.
The week closed near the low. It is therefore a Low 2 top (micro double top with the high from two weeks ago) sell signal bar for this week. Traders are wondering if the bulls are exhausted. If they are, traders will expect a retracement of about half of the rally.
Traders know that trends resist change. Also, the gap above the Feb. 24 high is an important magnet above. That was the start of the pandemic crash. The E-mini is near enough to make traders think that the rally still could get there before there is a reversal down.
Will the rally continue or reverse down?
The four weeks of sideways trading reflects these mixed signals. It is in Breakout Mode. The bulls want a rally from here to continue up to a new high. At a minimum, they want a test into the February gap.
However, the bears want a double top with the February high. A reversal down from here or from the gap would be a lower high double top. They expect a retracement of about half of the three-month rally.
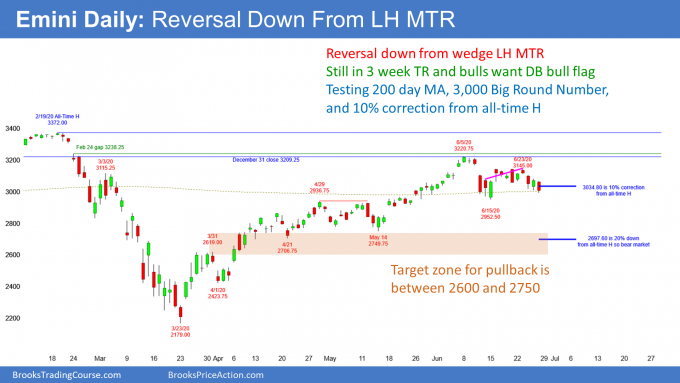
The daily E-mini chart reversed down strongly on June 11 (see chart below). Since then, it has then been in a tight trading range. The bulls hope that the trading range is just a pause in the three-month rally. They see the trading range as a double bottom bull flag. They want the rally to resume and test the gap above the Feb. 24 high. Then, they want it to continue up to a new high.
Friday’s selloff stopped at the support of the 200-day moving average and the 3,000 Big Round Number. It closed just below 10% down from the all-time high. The E-mini is therefore back in correction territory. These three prices are magnets and could support next week.
Every trading range has both a credible buy and sell signal. The bears see a small wedge rally a lower high after a reversal down from a buy climax. This week’s reversal down is from a lower high major trend reversal. There is also a double or triple top in the tight trading range. But the E-mini is still in the trading range.
So, what is more likely, a bull or bear breakout? The E-mini would not be in a tight range if either side had a significant advantage. It is neutral. When that is the case, it becomes bullish for a day or two and then bearish for a day or two. Most breakout attempts will fail.
Everyone knows there will be a breakout within a couple weeks. But traders also know that the first breakout up or down will fail. They need to see a couple consecutive closes above or below the range to conclude that the breakout is successful.
The bulls want a new all-time high
How can the market rally when 10% of the country is out of work and consumer spending is way down? There is a simple fundamental reason and I have mentioned it many times. The Federal Reserve said that it would “print infinite money” to protect the economy.
Traders have concluded that there is a floor under the market. If it can’t go down, maybe it can only go up. Institutions are buying an overbought market with mediocre earnings during a pandemic when consumer spending is greatly reduced because they believe that the one fundamental fact is more important.
From a technical perspective, the E-mini has been in a trading range for 2.5 years. This rally is simply a bull leg in that range. In a trading range, legs go up and legs go down. This is just an up leg. It is strong, but so was the down leg. No matter, the E-mini is still in a trading range. A rally made sense when the E-mini broke below the bottom of the range in March. A selloff makes sense now that the E-mini is back near the top of the range.
How far can a bull breakout go?
The minimum goal for the bulls is a test into the gap above the Feb. 24 high. That gap was very big, and it was the start of a 35% selloff. It is therefore very important. The E-mini is near enough to make many traders believe it could get there.
If it does, the rally will be a test. The bears sold strongly at that price in March. Will they sell again? Or, will the bulls be strong enough to take the market to far above the old high?
There is a 50% chance that the E-mini will test into the gap and a 40% chance of a new high. Furthermore, there is a 30% chance of a strong breakout to far above the old high.
But there is a lot of supply around the old high. If the E-mini gets a couple closes below the June 15 low, the odds will be that the 15% correction is underway.
Most corrections are not clear until they are about half over. Two closes below the June low would be more than a 10% selloff from the June high. If that is half of the correction, the second half would take the market down to around 2600. That has been my target for since April.
What does “seasonally bullish” mean?
One of the reasons why I do not pay too much attention to trades based on the calendar is that it is impossible to make money trading them. The margin is small, at best, and the stop usually has to be far relative to the expected gain.
For example, when I say that there is a bullish window from June 26 to July 5, what am I saying? Does it mean that the stock market will rally strong from the first day of the window until the final day? No, it means that when I tested this many years ago, I noticed that 75% of the time, the close of July 5 was above the close of June 25. It only has to go up one tick during that period to qualify.
It is important to understand that if you look at a yearly chart where each bar is one year, the longest pullback in history was only three bars. That occurred in the Great Depression. Even a two-bar (year) pullback is rare.
The stock market has been in a bull trend forever. That means the probability of any day being higher than any prior day is more than 50%. In fact, in any five-day period, there is a 56% chance that the market will be up.
Therefore, saying that the stock market has a 75% chance of being up during the current window is not significantly greater than any other five- to 10-day window. Consequently, traders should look at calendar tendencies more as entertainment than as a tool to make money.
Disappointed bulls from February
Many of the bulls who bought in February and who did not exit are afraid of a double top and another big selloff. They are hoping that the rally will go a little higher to allow them to exit without a loss.
That stock that they are eager to sell is supply. There might be too much of it to overcome any buying by traders wanting a new high. We will find out in July.
Sometimes the market will go a little above the old high before traders sell. Some want to see if the breakout will be so strong that they are willing to hold onto their stock. If they think it is not strong enough, they will sell.
A reversal down from above the February high would still be a double top. I would call that a higher high double top.
If there is a trend reversal, where is support?
The bears want a reversal down. It does not matter if it began this week, or if it comes from a test of the gap or from above the old high. They see the 2.5-year trading range and are confident most breakout attempts up or down will fail.
They know that the three-month rally was surprisingly strong. Additionally, they understand that a reversal down will be a leg in the trading range and not the start of a bear trend that will fall below the March low. They expect a higher low and for the bulls to look to buy somewhere in the middle of the range.
In a trading range, traders expect reversals to reach around the middle of the range. That is 2800. Also, a 50% retracement of the three-month rally is around 2700. And so is a measured move down based on the height of the June trading range.
The breakout above the March 31 high of 2619.00 was never tested. That is around 2600, which is another Big Round Number and therefore a magnet.
Within a trading range, there are always many targets. I just mentioned some of the more significant ones. But somewhere between 2600 and 2800 is what most traders expect.
Legs in trading ranges tend to go further than what seems reasonable. Since the E-mini is still in a trading range, traders expect a bear leg to begin soon. There is a 50% chance that it will reach to around 2600 before the bulls buy aggressively again.
Trading Room
Traders can see the end of the day bar-by-bar price action report by signing up for free at BrooksPriceAction.com. I talk about the detailed E-mini price action real-time throughout the day in the BrooksPriceAction.com trading room. We offer a two-day free trial.


