
Silver is extremely overbought and the QuantCycles Oscillator for silver turned bearish, reports John Rawlins.
While all the talk has been about gold as it races to all-time highs, silver’s recent rise has been even more impressive on percentage terms. And silver is much more an industrial metal these days that a precious metal/inflation hedge.
Regardless of how you define silver, it has moved to an extreme, so we decided to look at what the QuantCycles Oscillator is showing.
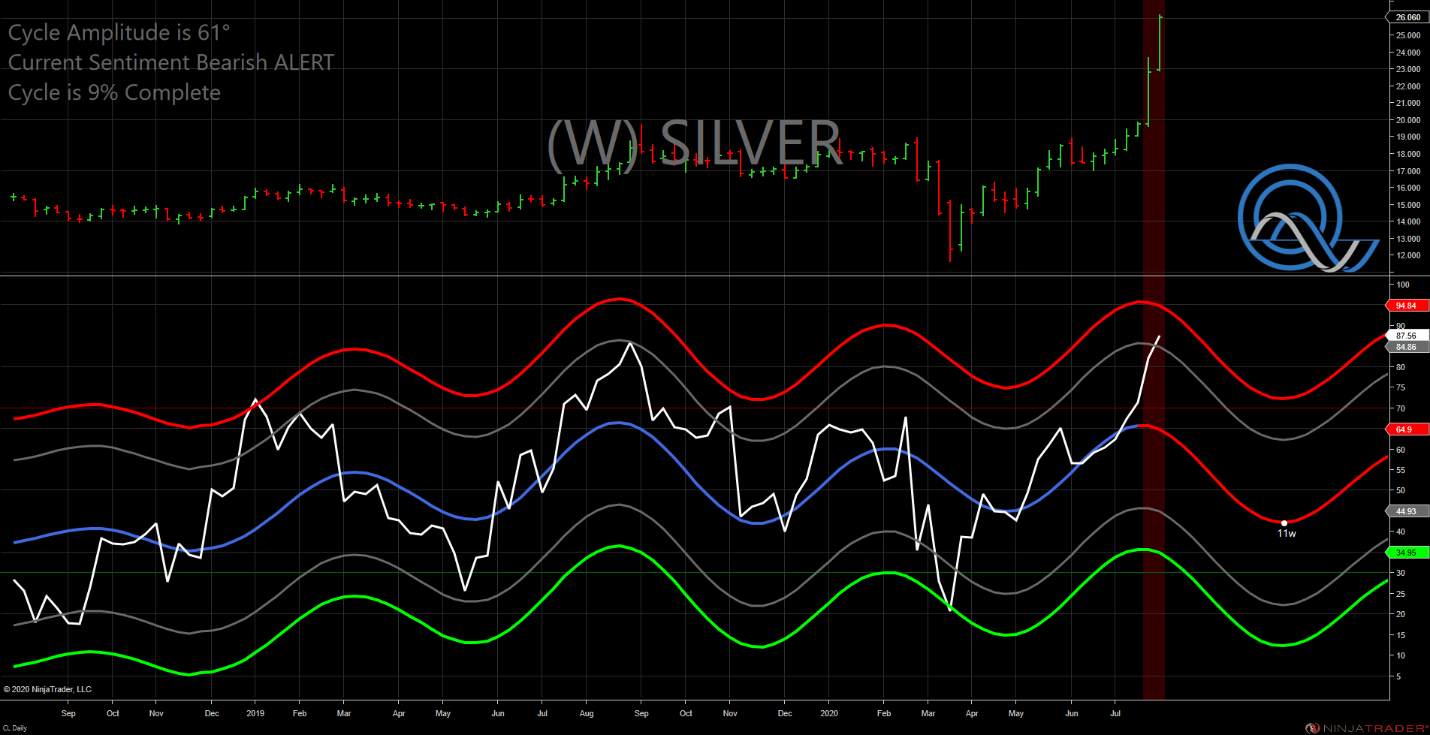
As you might suspect, the long-term oscillator shows silver nearing extreme overbought territory. This comes a week after the QuantCycles showed a top in silver, creating a strong shorting opportunity (see chart below).
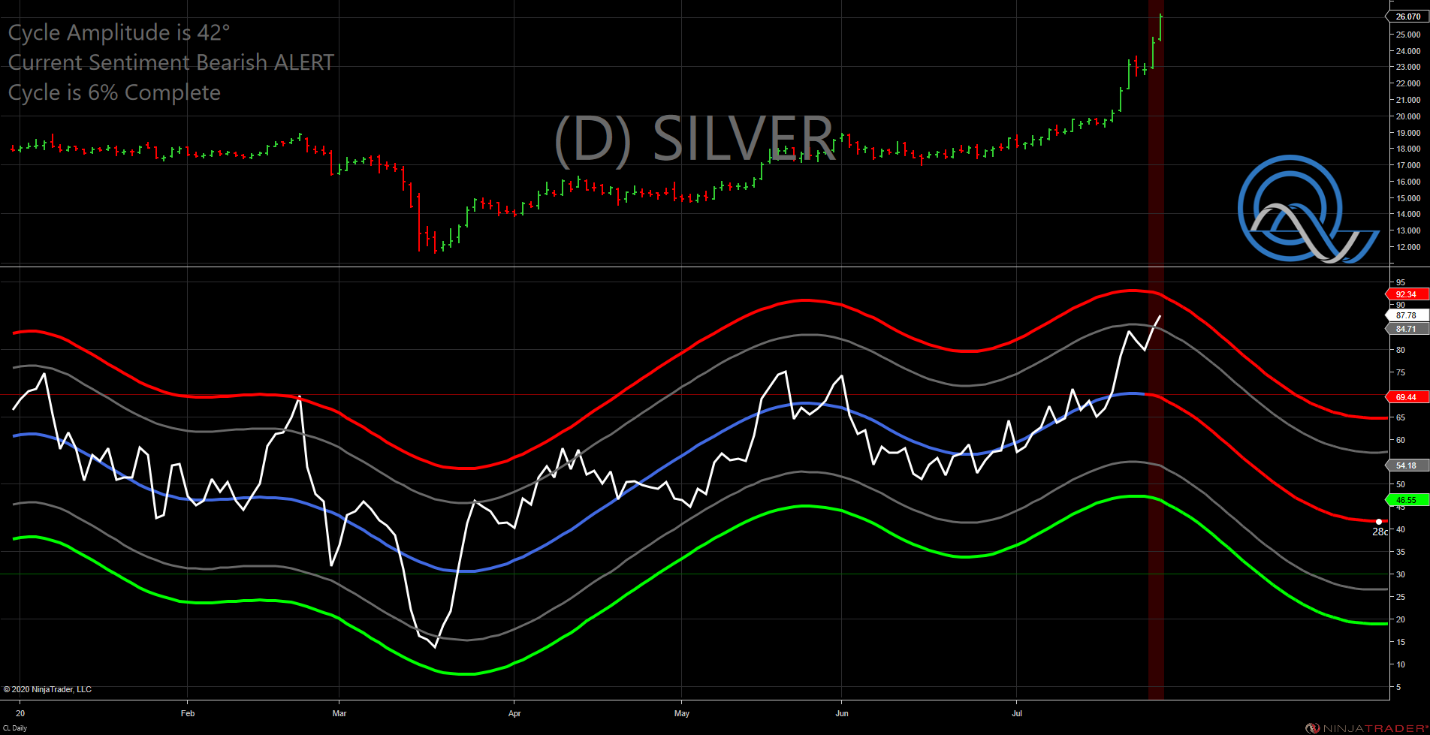
In what is a relatively rare case of symmetry, the daily QuantCycles Oscillator for silver matches the weekly very closely. As you can see, it is nearing extreme overbought territory shortly after the oscillator tuned bearish (see chart below).
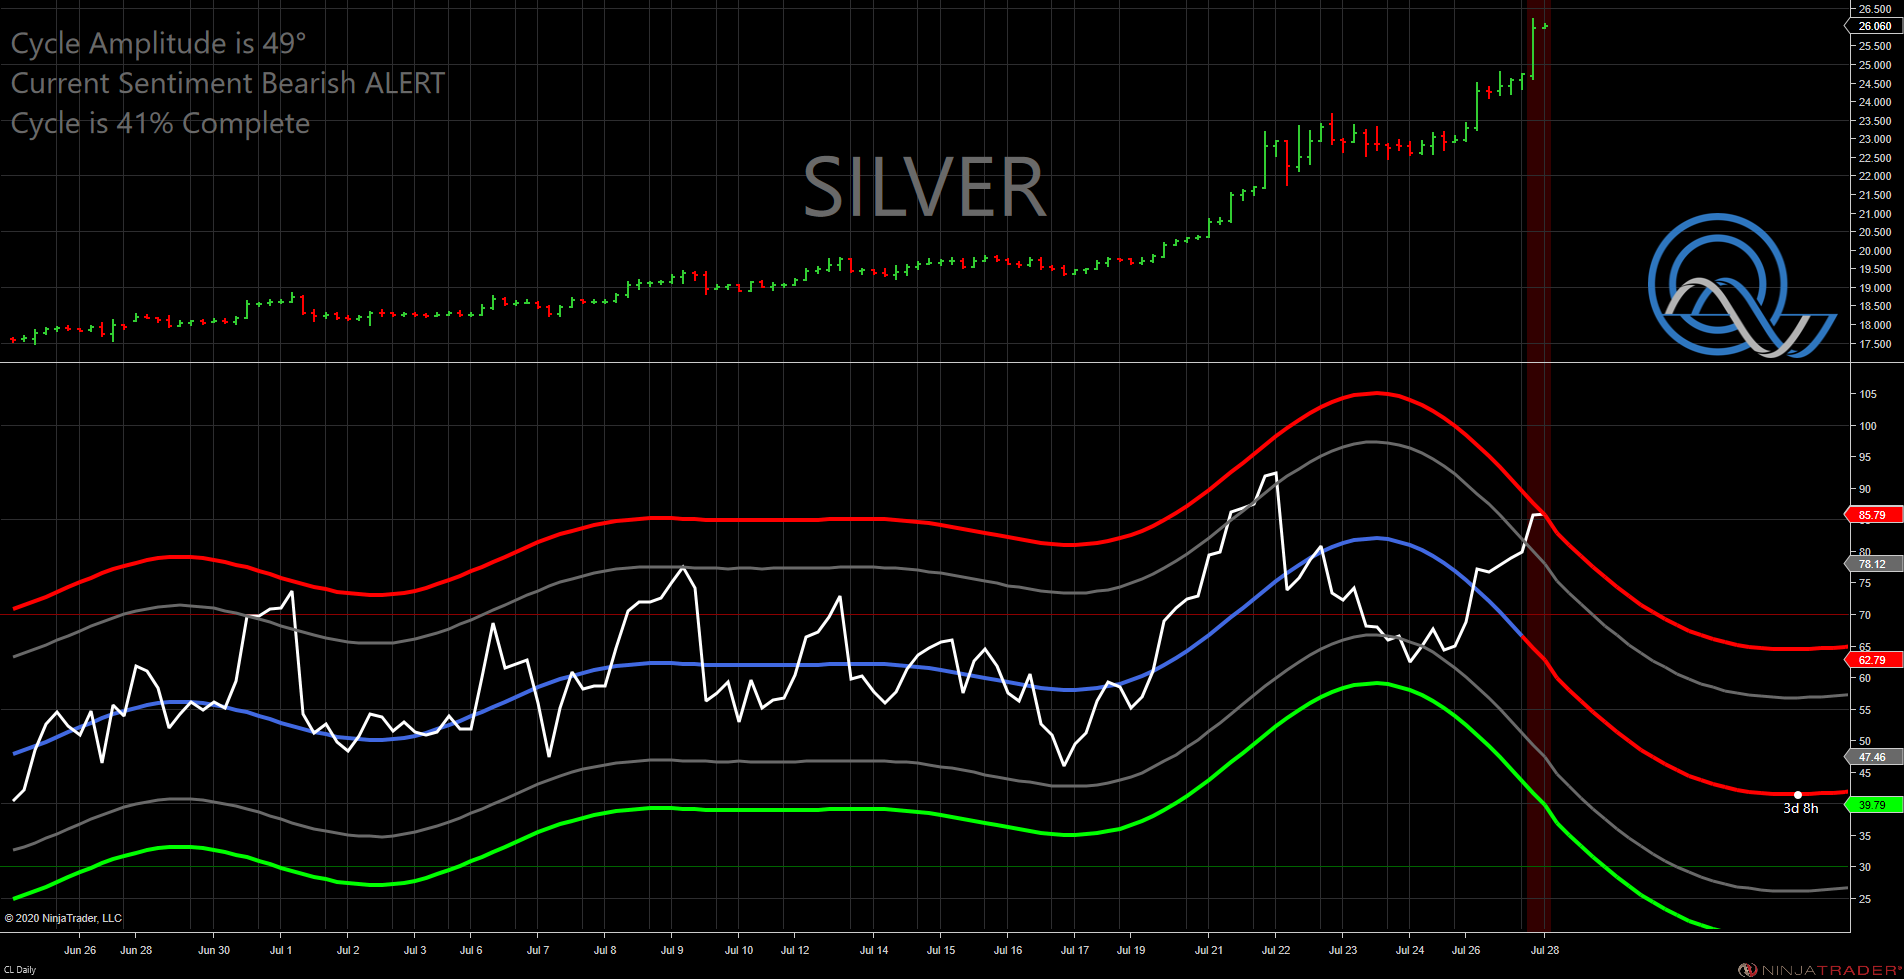
With trading, timing is arguably the most important factor. Many traders lament that they were right, but too early, or perhaps too late. That is why we utilize multiple timeframes to zero in on the best opportunities. Late last week silver had a slight pullback in its rally as the oscillator peaked. With the recent price spike, silver is pushing overbought territory once again on our four-hour chart (see below).
As mentioned above, this is a rare case of symmetry across multiple timeframes. All indications are for silver to experience a significant correction. The only question seems to be how to play it: Short-term profit, or a longer term position that tries to exploit the 11-week downturn predicted on the weekly oscillator.
In today’s volatile markets, it’s best to cover your bases. This can be done by using the smallest increment possible (E-mini/E-micro contracts or ETFs) so that you can bank some short-term profits, while hanging on to longer-term shorts to exploit a larger move.
John Rawlins described the value of the QuantCycles Oscillator recently at The Orlando MoneyShow.
The QuantCycles indicator is a technical tool that employs proprietary statistical techniques and complex algorithms to filter multiple cycles from historical data, combines them to obtain cyclical information from price data and then gives a graphical representation of their predictive behavior (center line forecast). Other proprietary frequency techniques are then employed to obtain the cycles embedded in the prices. The upper and lower bands of the oscillator represent a two-standard deviation move from the predictive price band and are indicative of extreme overbought/oversold conditions.


