
Jeff Greenblatt has highlighted a potential major low in gold based on Gann calculations.
The Gann calendar allows the trader to maneuver larger time frames similar to the way an intraday trader can use price and time to determine turning points on 1, 5- and 15-minute charts.
The recent Gold chart is a good example. One must study the history of the chart to make sense of the current situation. I suppose that’s true with other methodologies as well, but its critically important when it comes to price and time. Numbers tend to replicate, and this could be the ‘tell’ when it comes to identifying opportunity.
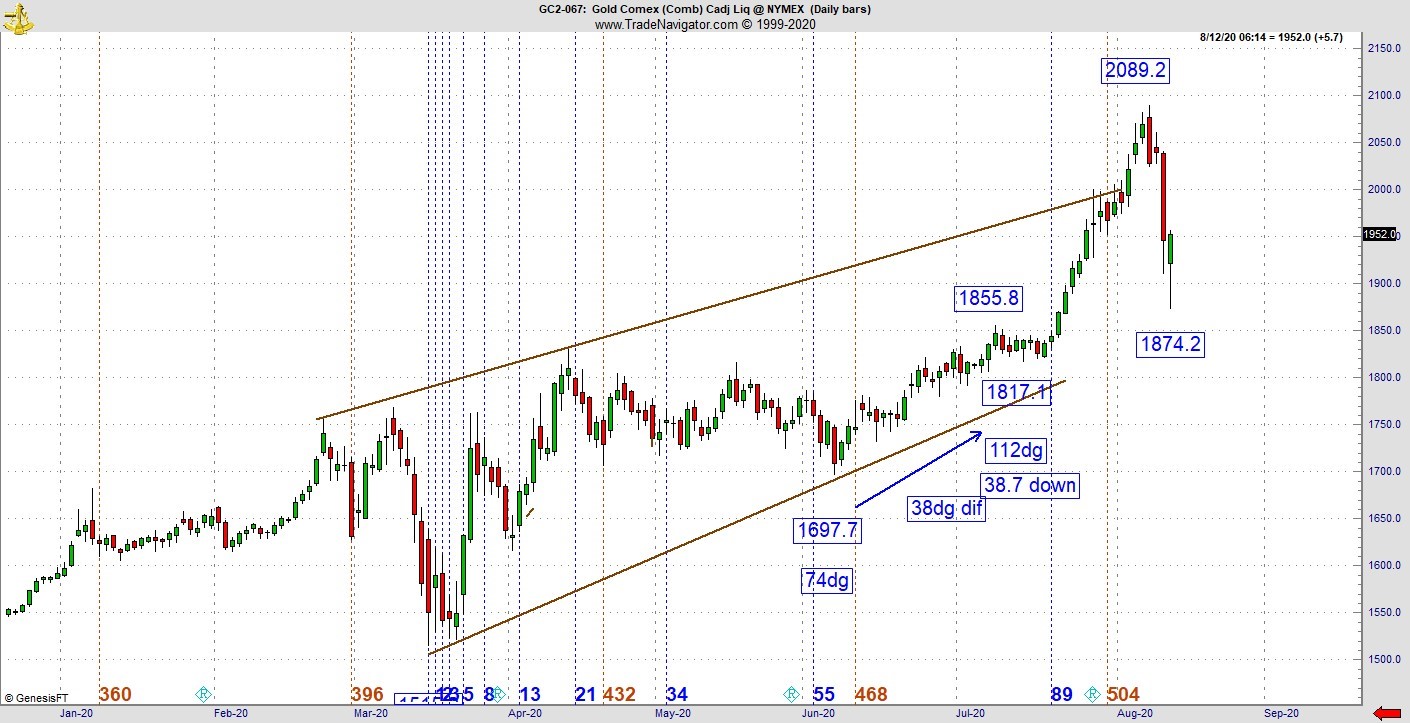
For instance, gold made a low on June 5 and another on July 14. The significance of the Gann calendar is each day of the year has a different vibration and this can be particularly important when it comes to swing trading. As you can see, the June 5 vibration is 74dg and July 14 at 112dg (see chart below). That’s a difference of 38 while the pullback into that pivot was roughly 38 points. Right now, on the continuation chart we have an interesting reading at 1874.2 with a lower tail. The lower tail right now means one of two things: This could be the low as precious metals gets ready for its next leg up in the bull market. On the other hand, a break of this pivot with the symmetry already in place would mean a much deeper correction.
One can’t know for sure; in trading there is no such thing as a guarantee. So, lets scale down to an intraday and take a better look. On the hourly, with the low at 1874.2, this leg is down 75 hours, that’s particularly good (see chart below). We already see two wide range green bars to start which means there is highly likely short covering manifesting.
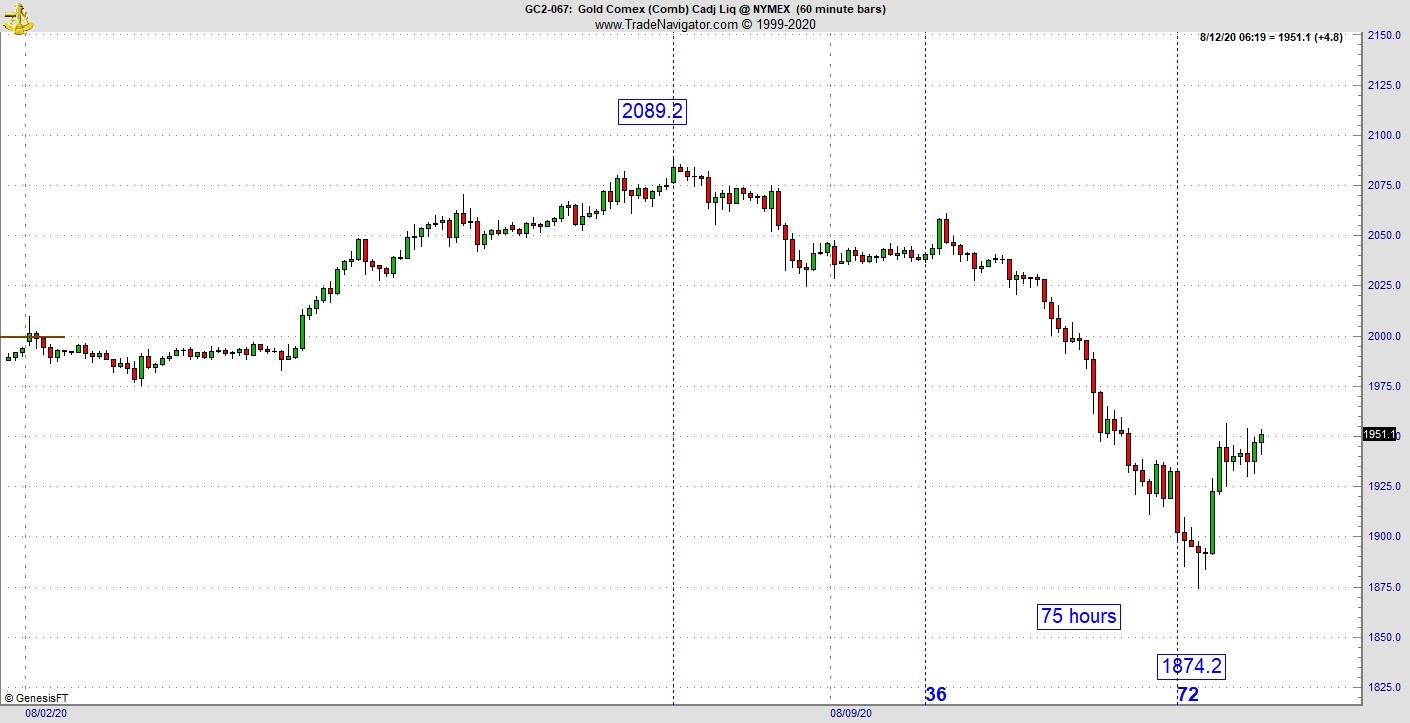
As I said, one never knows but its lining up well and this is a high probability low given we have price and time lining up in two larger degree time frames. Let’s face it, a 75-hour low is more significant then if it was 75-5-minute bars. Personally, I don’t like picking tops and bottoms but this one looks good. As far as a trading strategy is concerned, if you take the trade here it’s already far from where the stop loss would have to be placed below the low. A better strategy is to start looking at a pullback which has more price and time symmetry.
The implication here is the bounce int eh U.S. dollar, which started late given its 89 vibration could be aborting as well. At the very least this chart should have more upward testing but given the bull market nature of the pattern, this is enough information to consider the next leg up. As per the Dow example shown here last week, the Dow has been mostly straight up through Tuesday after its Gann calendar low back on July 30.
The college football season is becoming the latest catastrophe in this economic disaster. This hurts on many levels. Obviously, the athletes who train hard are losing a once in a lifetime opportunity to be on that big stage. But the country will lose a major Saturday fall tradition. Think of the programming gap on Saturdays. You must realize in big time college athletics, it’s the basketball and football programs that end up financing the rest of the sports that don’t make money. All of that is gone. The Las Vegas sports books (and newly minted sports book in numerous states) will take a major hit and according to several sources, they could survive but if for whatever reason the NFL doesn’t go to make up for lost revenue, they could also be looking at permanent financial ruin. The logic is the gamblers will take the money they normally allocate to the college game on Saturday to the NFL on Sunday. For his part, the President stated he wants to see NFL football this year so long as the players don’t take a knee for the anthem.
Where does this end? I don’t have an answer for you other than to say it will get worse before it gets better. The second half of August means the national conventions but in a normal year the Summer Olympics would’ve just wrapped up on Sunday night. Nobody seems to notice and that’s sad considering many college players who might have a shot at the 2021 NFL Draft probably will be passed over.
August is normally a paint drying month as far as the charts are concerned. This is a time to be especially disciplined because its easy to get roped into one of those endless tight consolidations. Avoid the temptation to get into a whipsaw configuration. What I’ve noticed lately for the aftermarket action in the E-mini and E-micro markets is once trading resumes in the afternoon at 6pm EST, the market is remaining flat most days for at least the first hour.
In prior months there was good action roughly 15-30 minutes after trading resumed. Right now, many of the patterns don’t seem to start kicking into gear for at least an hour or two. This is likely to change the closer we get to September. As traders, once we get used to a specific condition, it changes. That’s why its so easy to get trapped in tight ranges.
If you have been long these markets, congratulate yourself for realizing the Fed has propped it up. It’s been a forgiving market for those who understand how the game works. But it won’t last forever. Sadly, many buy and hold types who don’t understand the game, think the market always comes back have been lucky. The smart money will figure out when the market will start rolling over. For the rest of us, intraday to swing trading has been the avenue for those who prefer skill over luck.
If you want more information, go to: Lucaswaveinternational.com and sign up for the free newsletter.


