
Al Brooks warns that a correction is coming in September for the E-mini.
The E-mini S&P 500 futures is in a strong bull trend and it should trade higher this week. It might even accelerate up the following week. Since the buy climax is extreme, there is a 50% chance of a 10% to 20% correction starting in September. However, traders will buy the selloff.
The month of August has one trading day left in August. August will probably remain a big bull bar closing near its high. It is also closing well above the February all-time high. This is a breakout to a new high.
Next month is the follow-through bar. It probably will not be another big bull bar like August (see monthly chart below). But if it is, traders will expect a continued strong rally to the end of the year.
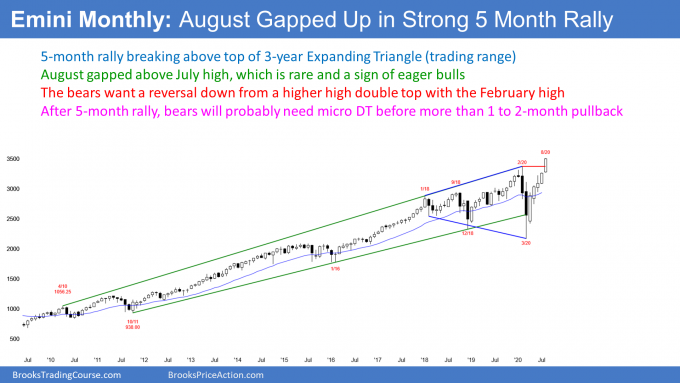
However, if September is a bear bar closing on its low and below the February high, traders will conclude that July was a failed breakout and just a bull trap.
The August high is just above the top of the expanding triangle that began in 2017. The bears hope that July is just a buy vacuum test of the top of the triangle. They want a reversal down.
But after five consecutive strong bull bars, traders will buy the first one- to tw0-bar pullback. Consequently, there is not much downside risk on the monthly chart for the remainder of the year. The bears will likely need at least a micro double top before they can get a reversal back to the middle of the three-year trading range.
August gapped up, will September repeat
Gaps on the monthly chart are rare. This is because most days do not gap up. To get a gap on the monthly chart, there must be a gap up on the first day of the month. Furthermore, the gap has to be above the high of prior month and not just above the prior day.
Despite this, August gapped above July and the gap stayed open. Since August might close near the high of the month, traders should wonder if September will gap up to a new all-time high and above the August high when September begins on Tuesday.
A gap up is a sign of aggressive bulls. This five-month rally has been very strong, and traders are chasing it up. Consequently, they might buy a gap up on Tuesday.
Most small gaps close before the bar closes. Since this is a monthly chart, if there is a gap, it will probably close before the end of September. However, if it stays open and if September closes near its high, the chance of the rally lasting all year will go up.
What will happen in September?
Whenever a market is in a buy climax, there is always the risk of a surprisingly quick, big profit taking selloff. It can come in many ways. For example, September might rally for the first half of the month and then sell off. It would then be a bear reversal bar.
Another thought to keep in mind is that September could trade above the August high, maybe even gapping up, but then work its way down to below the August low. September would then be an outside down month.
Both of these possibilities would turn September into a sell signal bar on the monthly chart. That could lead to a one- to two-bar (month) pullback. However, the bears will probably need at least a micro double top before they can create a bear trend. Traders will buy the first pullback, even if it is surprisingly big.
The weekly E-mini S&P 500 futures chart formed its fifth consecutive bull bar last week (see below). Also, there is now a nine-bar bull micro channel. Every low for the past eight weeks has been above the low of the prior week. This is a sign of very eager bulls.
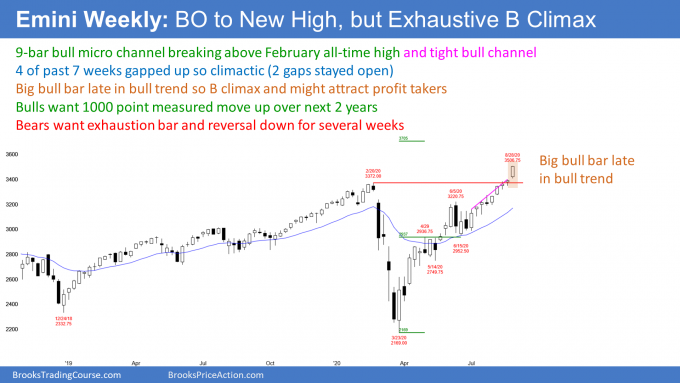
In addition, five of the past weeks gapped up. Although three of the gaps closed, it is sign of eager bulls. With this week closing near its high, there is an increased chance of another weekly gap up on Monday.
But this behavior is extreme and therefore a buy climax. The stop for the bulls is getting far below. Traders are beginning to consider reducing their risk. The easiest way to do this is to take some profits and reduce their position size.
It is important to note that the bulls have been eagerly buying above the low of the prior week. Many will be happy to have an opportunity to buy below the low of the prior week. Consequently, if there is some profit-taking, it will probably only last one to three weeks. Traders will buy the pullback and expect a test back up to the high.
The daily E-mini futures chart has been in a Small Pullback Bull Trend since June (see chart below). Traders have been aggressively buying every one- to three-day pullback. They will continue to do that until there is a bigger pullback.
Sometimes a Small Pullback Bull Trend accelerates up in a blow-off top. This is more common in extremely strong trends, like this one. Therefore, there might be a sharp rally next week, even after the strong two-month rally. If so, it will probably be the end of this leg up and lead to several weeks of lower prices.
A Small Pullback Bull Trend is a sign of very strong bulls. A strong bull trend does not usually reverse into a bear trend without first transitioning into a trading range. Therefore, even if there is a surprisingly sharp selloff in the next month or two, traders will buy it.
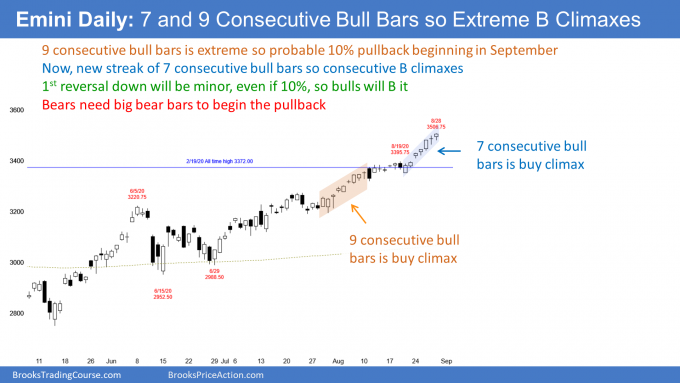
Streak of consecutive bull bars still makes 10% correction likely
Over the past two weeks, I talked about the streak of nine consecutive bull bars that ended a couple weeks ago. That many consecutive bull bars is unusual. It is therefore unsustainable and climactic.
There was a streak of eight bull bars in June. It led to an 8% selloff to below the bottom of the streak.
The most recent nine-bar streak was 2.5 years ago. It became the first leg up in a parabolic wedge buy climax. Two weeks later, there was a 10% correction that reversed to far below the start of the streak.
There is now a new streak of seven consecutive bull bars on the daily chart. This is therefore a consecutive buy climax. That increases the chance of a profit taking selloff coming soon. The odds will go up if this seven-day streak extends with a few more bull days.
10% pullback will probably start in September
Despite the impressive rally since June, these buy climaxes give the bears at least a 50% chance of a sharp selloff down to the start of the streak beginning in September. The streak began just below 3200. That would be about 10% and comparable to the most recent two similar streaks. If the selloff continued down to the June trading range, which is a potential Final Bull Flag, the correction would be 15% to 20%.
If the current rally keeps adding bars, these streaks will get pushed further into the past. If there is no pullback within the next several more weeks, these streaks will have lost their influence. The market will then begin to focus on something else.
Trading Room
Traders can see the end of the day bar-by-bar price action report by signing up for free at BrooksPriceAction.com. I talk about the detailed E-mini price action real-time throughout the day in the BrooksPriceAction.com trading room. We offer a two-day free trial.


