
Apple’s stock split is altering the components of the Dow Jones Index, and the new entries have some interesting set-ups, reports Suri Duddella.
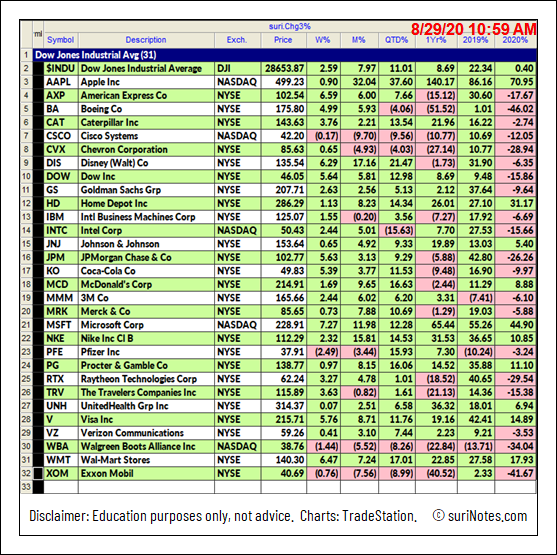
Due to the Dow Jones Index component company Apple Inc.’s (AAPL) decision to initiate a 4 for 1 stock split, reducing the index's tech-sector weighting, Dow Jones indices announced a major shake-up for the Dow Jones Industrial Average (DJIA): Salesforce Inc. (CRM) will replace Exxon Mobil (XOM), Amgen Inc. (AMGN) will replace Pfizer Inc. (PFE) and Honeywell Intl. (HON) will replace Raytheon Technologies (RTX).
Investors may be looking for current emerging chart patterns in the new DJIA index stocks for new opportunities.
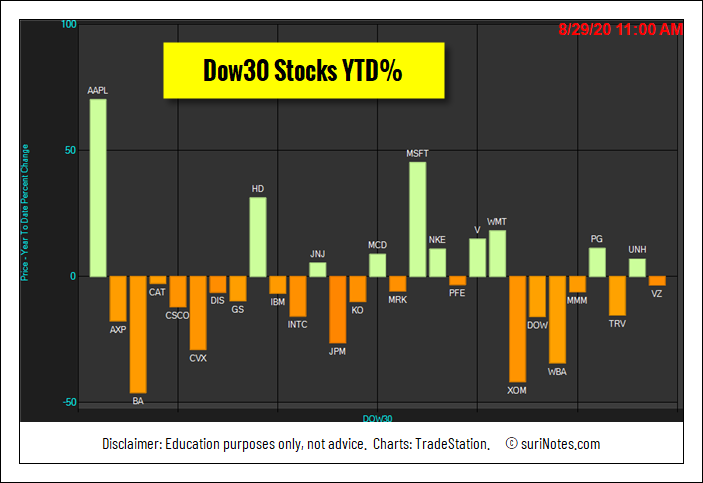
Here is current Dow Jones 30 stocks and their 2020 performances:
The ABC Chart pattern and its related AB=CD Chart Pattern are prime examples of "Symmetry" in the markets. These "Harmonic" patterns help traders to identify buying and selling opportunities in all markets and in all time-frames.
We highlighted this pattern in the recent past.
To recap, the main advantages of trading harmonic patterns are that they allow traders to determine risk vs. reward ratios beforehand as they forecast key market turning points and profit targets for traders. The ABC pattern can be a continuous or reversal pattern and is shaped like a lightning bolt.
We also recently described stocks exhibiting a Cup and Handle formations.
To recap, the Cup and Handle pattern resembles a cup with a handle and are continuation patterns that usually form in bullish trends. Most cup and handle patterns are reliable and offer great trading opportunities. They form in all markets and in all time-frames. The “Cup” formation is developed as consolidation phase during price rallies from the round bottom formation over multiple weeks to months. The “Handle” part forms due to a price correction after “Cup” formation and before a clear breakout to the upside.
Cup and Handle pattern structures show the momentum pause after reaching a new high in a U-Shape form, followed by another attempt to breakout. When this breakout from the rim of the cup fails, it starts to fall back to build the "Handle" structure. Usually, the handle structures are small, and the handle depth should not exceed more than 50% of cup depth. The pattern is valid only if price convincingly breaks out with increased volume above the rim of the cup.
Here we highlight both ABC and Cup and Handle patterns in the new Dow Jones components.
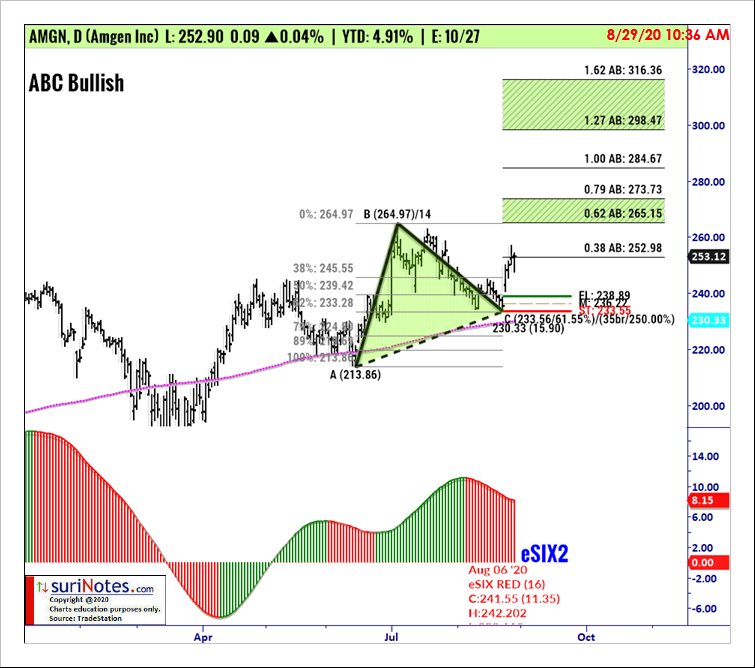
Amgen Inc. ABC Bullish Pattern
Amgen Inc. is trading in an ABC Bullish pattern on its daily chart above the long entry-level of $238.99 (see chart below). ABC Bullish patterns are valid only when price closes above the entry level with the confirmed uptrend. Enter a long trade above entry-level with a stop-loss below $233.55 (-$5.34). Profit targets are $265.10, $273.70, $298.50 and $316.40.
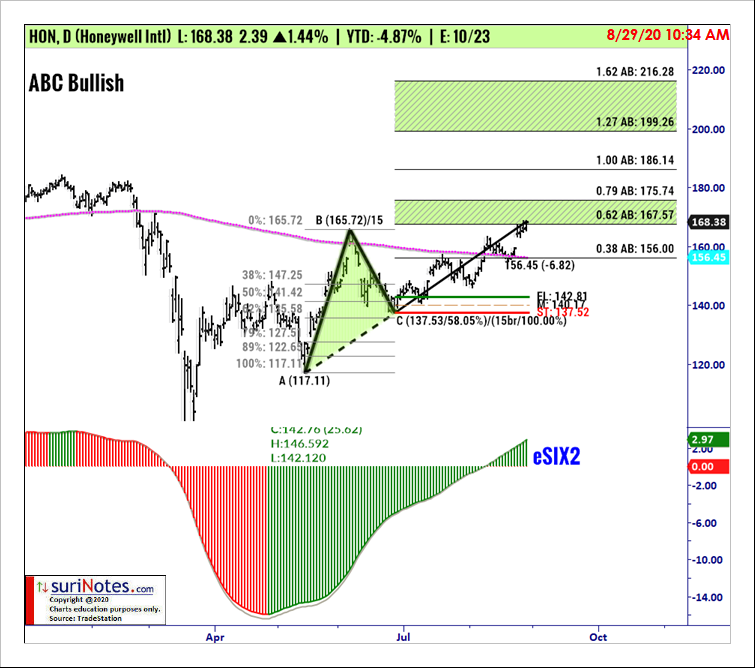
Honeywell Intl. ABC Bullish Pattern
Honeywell Intl. is trading in an ABC Bullish pattern on its daily chart above the long entry-level of $142.91 (see chart below). Enter a long trade above the entry-level with a stop-loss below $137.52 (-$5.29). Profit targets are $167.60, $175.70, $199.30 and $216.30.
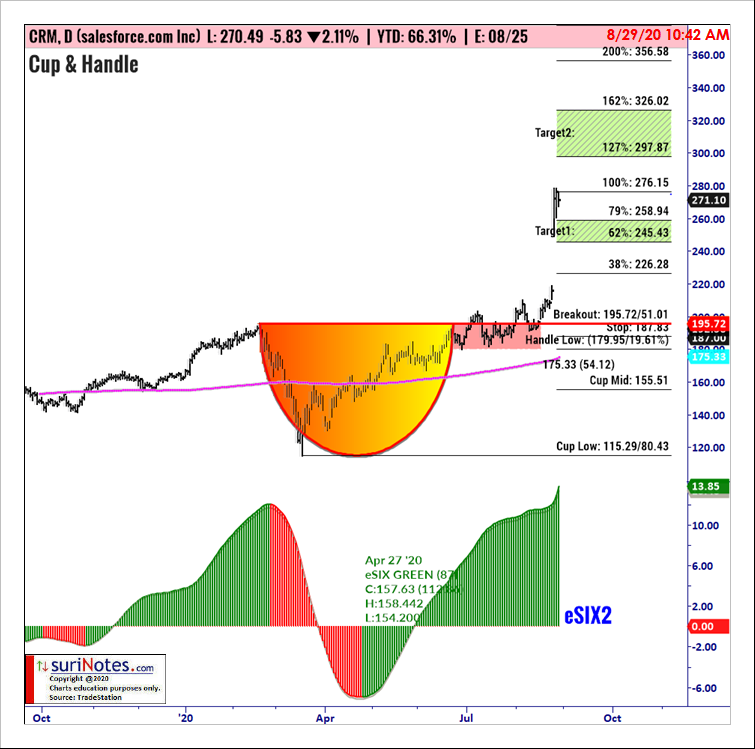
Salesforce.com Cup & Handle Pattern
Salesforce.com Inc. has formed a Cup and Handle pattern on its daily chart and is trading above the breakout level of $195.82 (see chart below). Cup and Handle patterns are valid only when price closes above the breakout level. A long trade is entered above the breakout level with a stop-loss placed below the lowest low of the mid cup $155.51, and the handle low $179.95. Profit targets are placed at $226.28, $245.40, $258.90, 276.10, $297.90 and $326. As profit accumulate, trades may choose to trail their stops to just below the previous profit target—which then would turn into support— once it has been reached.
Watch Suri’s archived presentation “How to Trade Chart Patterns With Market Context,” from Friday June 12 as part of the New MoneyShow Virtual Event. Find more of Suri’s work at surinotes.com.


