
September came through as anticipated, the market corrected. We have a couple of interesting technical markers that suggest a low or even bottom could be in, says, Jeff Greenblatt of Lucas Wave International.
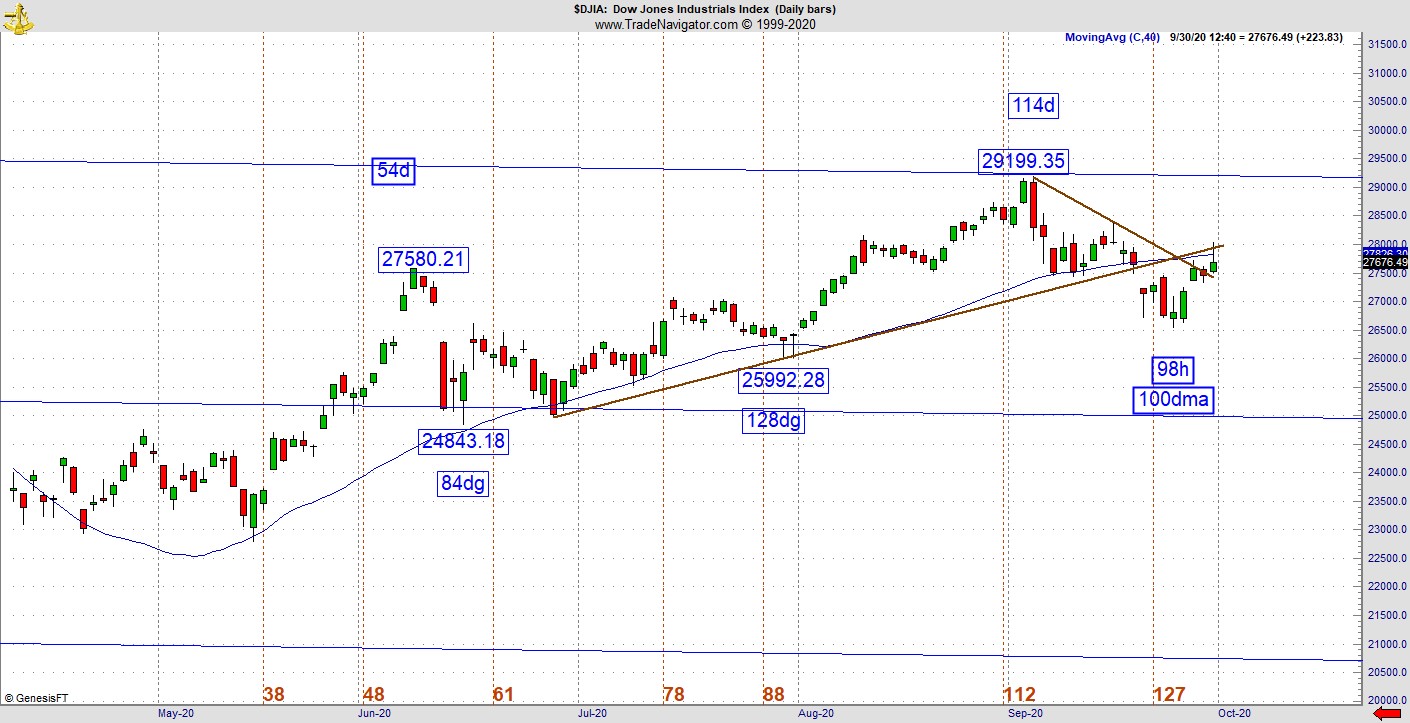
Let’s be clear we are not out of woods yet. But technically speaking we have two markers that support the low. One marker is the 100dma, which some people view as an intermediate level indication. This correction came down to the hundred on the Dow (DJIA) and S&P 500 (SPX). As far as price and time is concerned, the Dow is down 98 hours from a high of 29199.35.
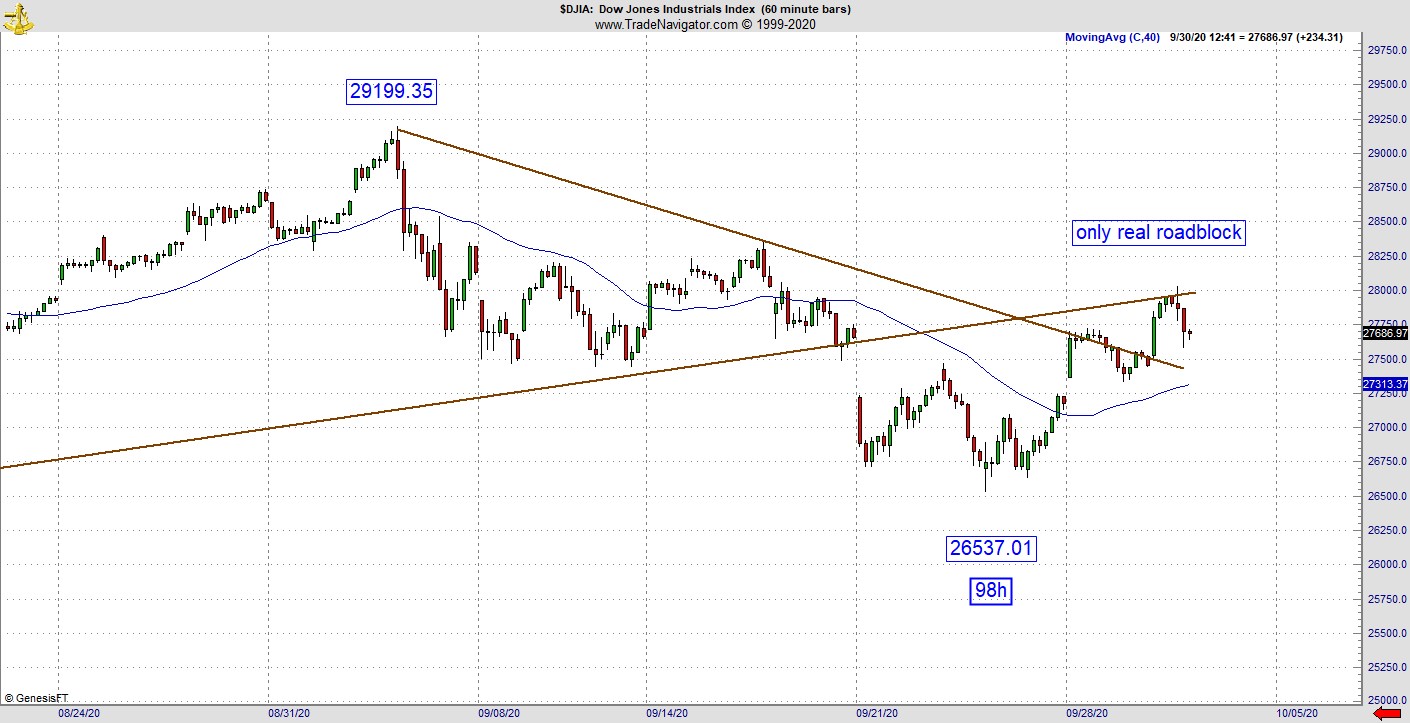
That’s where it gets dicey. Look at the hourly chart. On Wednesday the new leg up stalled right at the underbelly of the trend line, which means for now it stalled in the exact right place. If they can take out the trend line here, there is a good chance for serious upper testing.
There’s another five weeks to the election. Is there anyone who believes things will go smoothly as we get to the stretch drive? My personal view, since we know the end game for what the Fed is doing, is that the only way the market is going to drop in a big way is another black swan.
There are potential black swans out there but since so many have been discussed them already, is it still a surprise? It’s very possible. How many saw the new Project Veritas videos of money being exchanged in a major ballot harvesting scheme in Ilhan Omar’s district in Minnesota? Let’s be clear, this is worse than any manipulation blamed on the Russia hoax from 2016. They have the evidence, O’Keefe caught them! There are already many stories coming out about election fraud in early voting such as military ballots for Trump ending up in the wastepaper basket. But what is likely to happen? Probably nothing.
But here’s where it matters to those of us involved in financial markets. With each passing day, odds grow the election will not be decided on time. Markets despise uncertainty. There has never been an election in American history with more uncertainty. The stock market could be going up for now, but it won’t like what amounts to a banana republic result from the United States of America. So, if something goes wrong on election day and so many are already expecting it, is it still a black swan? I think so because even as 2020 has been the most "unique" year of our lifetime, many people still have normalcy bias and expect things to come back to normal. Many are in denial about the V-shaped economic recovery. Disney just laid off 28,000 employees. It’s never coming back to normal.
It has also been reported by Dave Hodges of The Common Sense Show that the only way Trump wins the election is if the military industrial complex gets their war with China in October. Hodges is a reliable source who is usually right, but sometimes, it takes longer to see his worldview come to pass. Nobody can prove that but did you notice H.R. McMaster came out in Time magazine the other day and said it’s "irresponsible" to discuss the military’s role in the election. That’s important and became mainstream news because several key Democrats have stated publicly that if Trump questions the results, the military will physically remove him from the White House. I’m sure you’ve heard some of this rhetoric but try to draw a picture of these potential events in your mind and then imagine what that might do to the stock market.
This is the risk level we are dealing with. It’s off the charts and unlike anything this generation of traders/investors have ever experienced. For now, we take the technical picture one day at a time. The good news is if anything bad is coming down the pike, we’ll likely see it in the chart pattern before it happens.
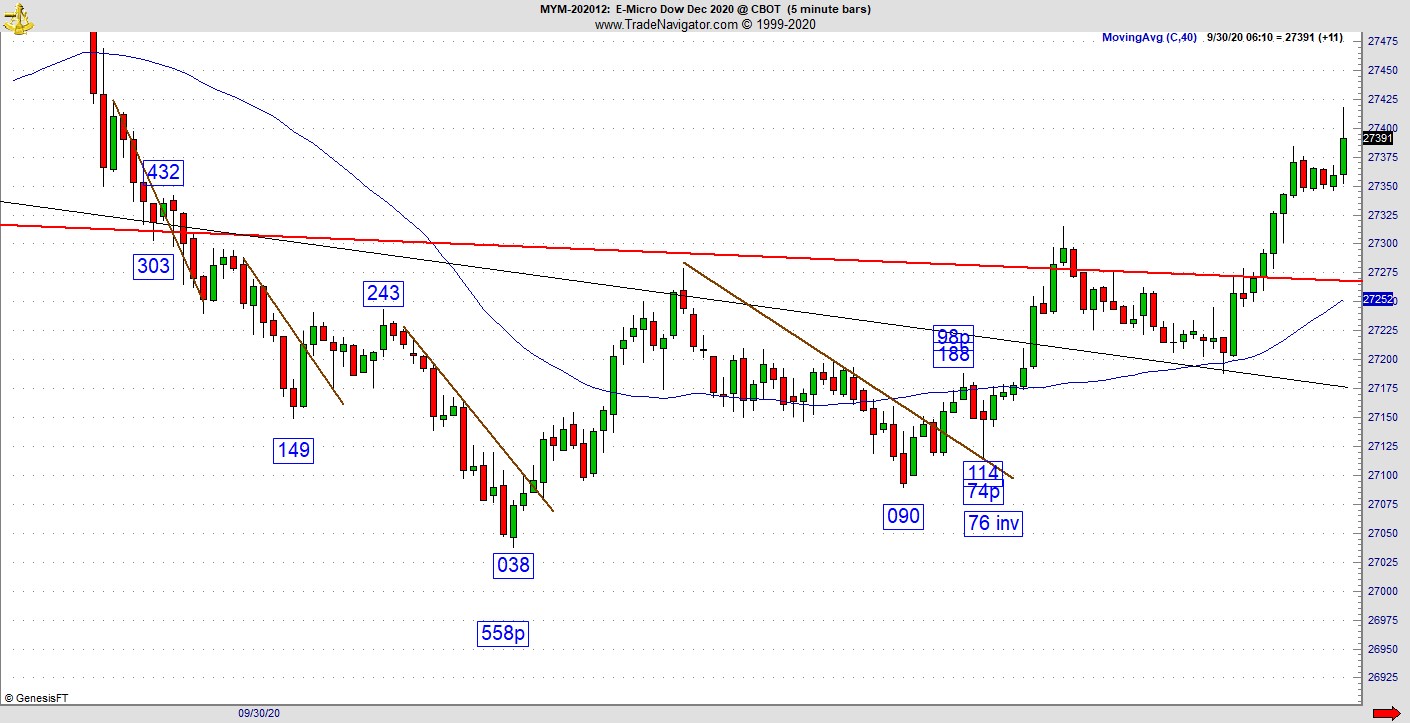
In this week’s lesson, here’s a setup that comes as a result of a combination of trend line and Kairos analysis. On the five minute you see the bigger perspective on the intraday E-Micro Dow (MYM), which should be the same as the E-Mini YM. How many times have you bought the break of a trend line only to end up in a bull or bear trap? One way to overcome it is to show greater discipline, especially in a market like this. What ends up happening more often than not is a retest of the trend line from the other side. This is the ideal situation, but the price action doesn’t always make it all the way back to the line. In this case we have a 76% retracement against the bottom and a 76 inversion on the low-to-low calculation.
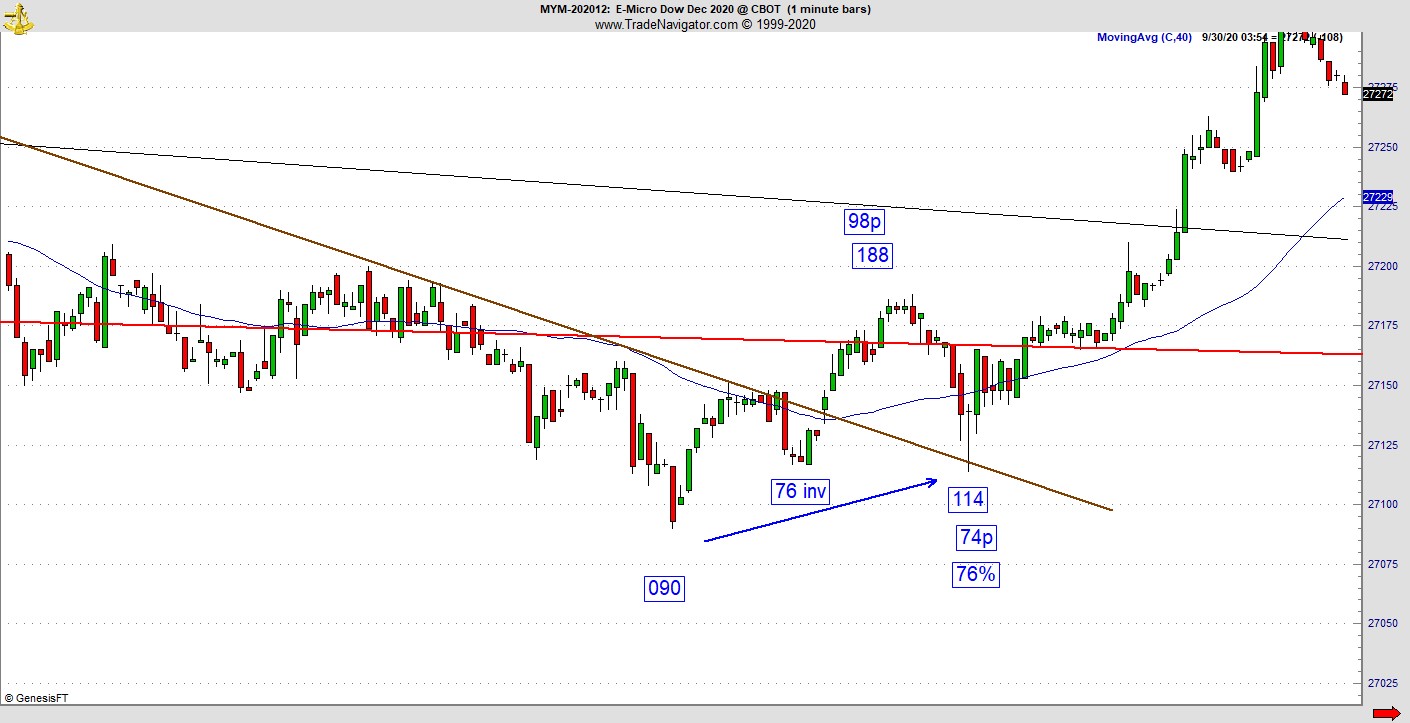
Normal people will conclude the difference between 114 and 90 is 24 points. What is the inverse of that? It’s 76, right? In a non-linear world, markets will do whatever they have to do to get price and time to line up. Then when we get 98 points up and 74 down is a 76% retracement. In order to pull this off one must be open to the possibility a retracement value can be just about any number, not just the 38, 50, 61 and 78%.
I’ve been teaching on retracements in this space for nearly four years. We have tons of examples but what many of you might not realize is the potential of the market to invert the numbers in order to make the vibrational square outs work. This is not a one-off situation; in my research I can literally show you hundreds of examples. That being said, this is a complex setup even for the person familiar with my Kairos work. But some of the trickiest examples do lead to great moves and this one is no different.
There’s a lot that goes into understanding this setup. First of all, you need to know how trend lines get tested, then you need to know how retracements square out with the rest of the pattern. There is no black box to this. One must learn the tendencies to know what the market is capable of. Then you need to understand how the smart money works and apply the tendencies in key spots on the pattern.
Stay disciplined as we are entering a likely historic period that is likely to impact financial markets. People might be talking about this election season 50 years from now. It’s no time to be complacent or just assume the market will continue higher just because it always comes back.
For more information about Jeff Greenblatt, visit Lucaswaveinternational.com.


