
The US markets appear to be pausing in an uptrend as the US prepares for major elections and their outcome in the first week of November, states Suri Duddella of suriNotes.com.
The majority of the index ETFs and sector ETFs are building cup-&-handle chart patterns and trading in handles. The underlying trend (eSIX) under in index and sector ETFs need to turn bullish for C&H pattern breakout trades to continue its uptrend direction.
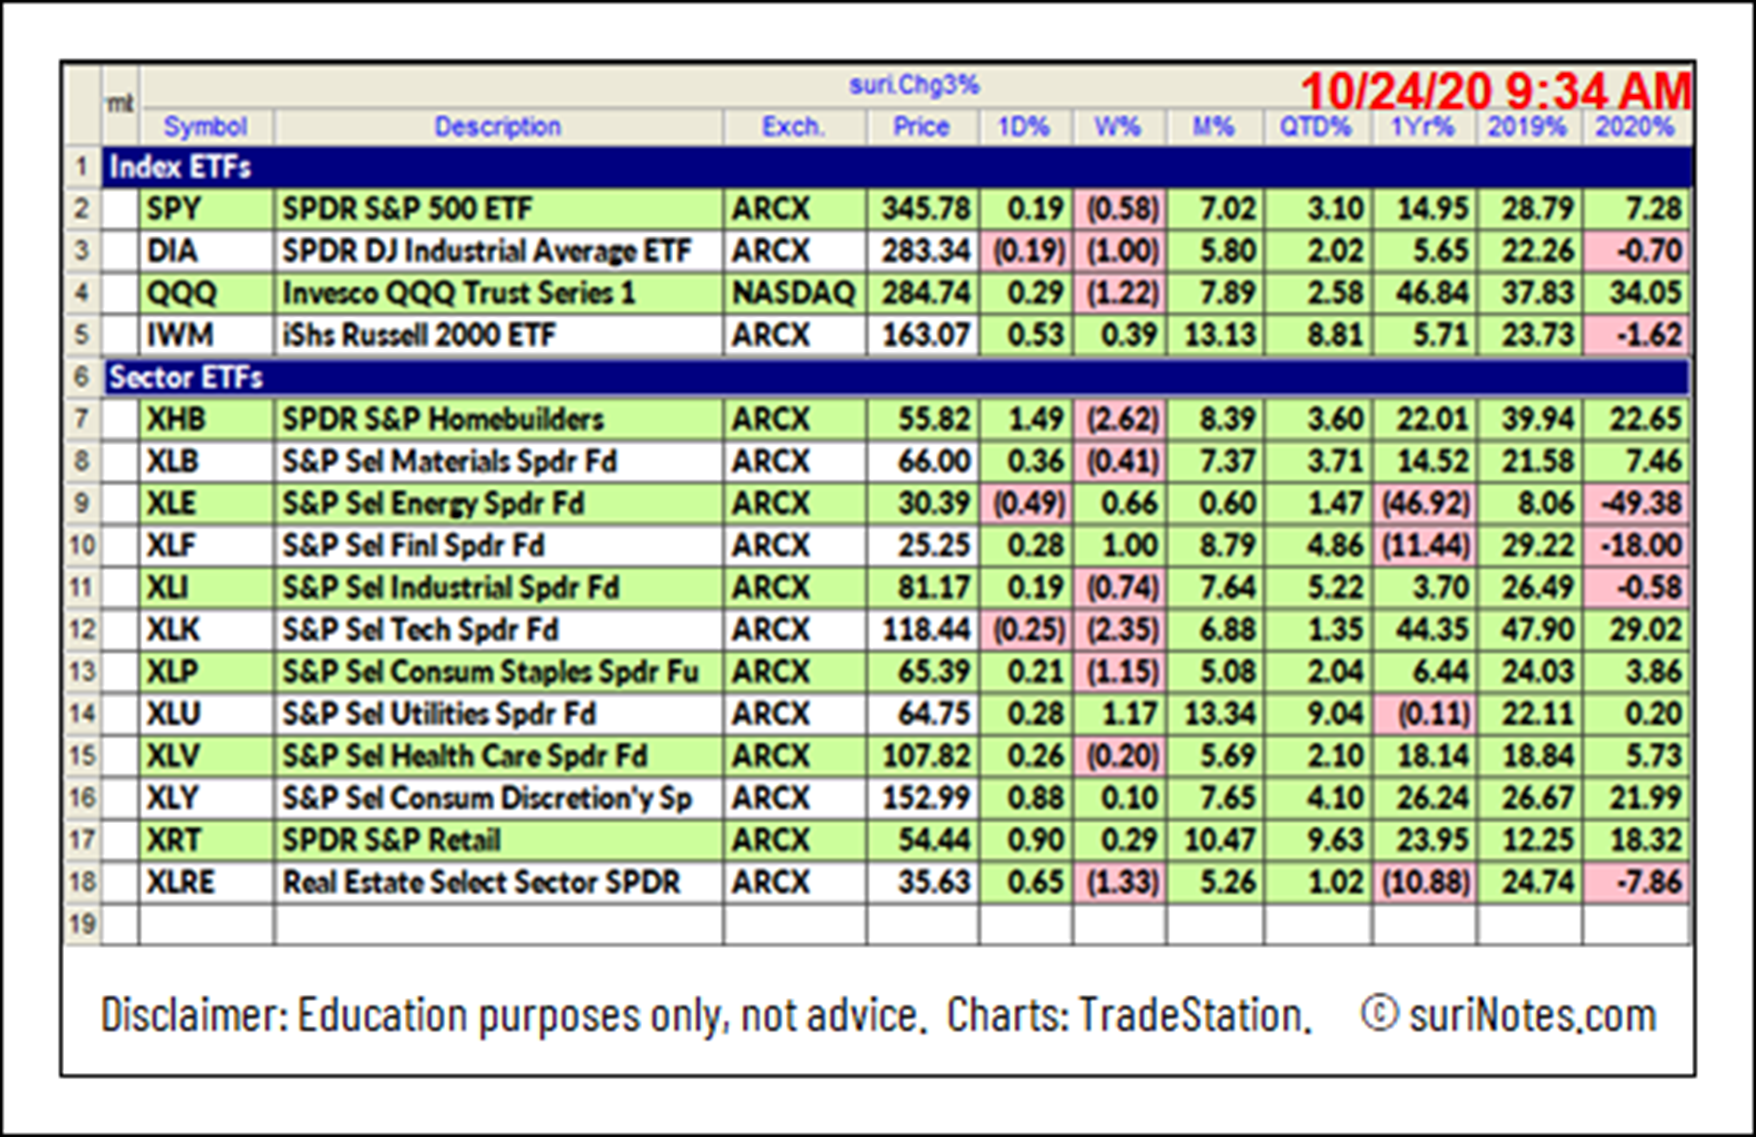
Here is a list of index ETFs and sector SPDR ETFs and their YTD performances in 2020.
Cup-&-Handle Patterns
The cup-&-handle chart pattern was developed and popularized by William J. O’Neil in the 1980s through his CANSLIM methodology, Investor’s Business Daily articles, and his book How to Make Money in Stocks.
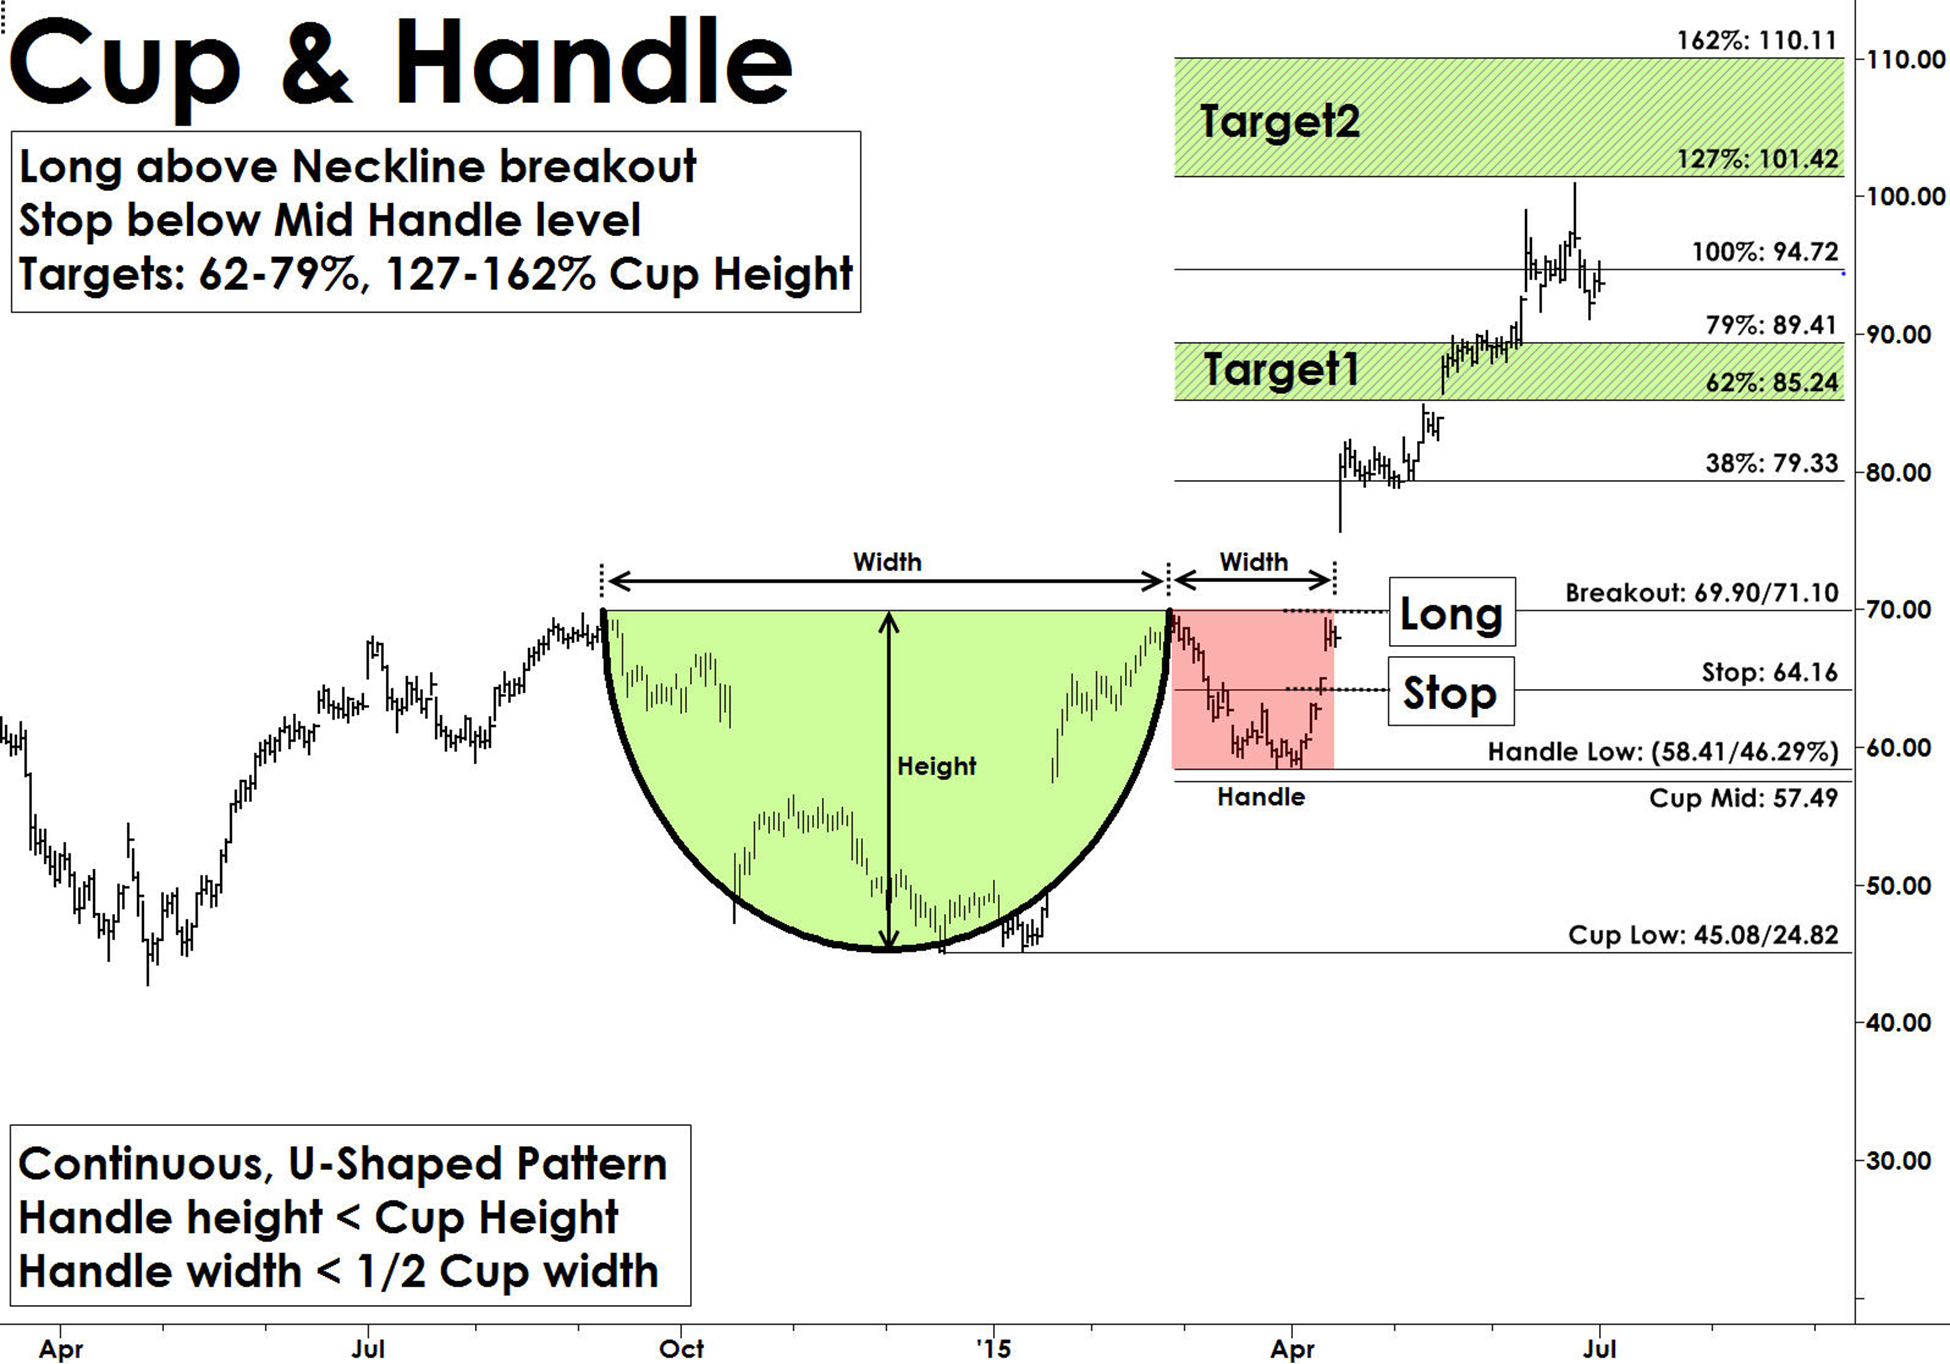
The cup-&-handle pattern resembles a cup with a handle and are continuation patterns that usually form in bullish trends. Most cup-&-handle patterns are reliable and offer great trading opportunities. They also form in all markets and in all timeframes. The “cup” formation is developed as consolidation phase during price rallies from the round bottom formation over multiple weeks to months. The “handle” part forms due to a price correction after “cup” formation and before a clear breakout to the upside.
Cup-&-handle pattern structures show the momentum pause after reaching a new high in a U-Shape form, followed by another attempt to breakout.
When this breakout from the rim of the cup fails, it starts to fall back to build the "handle" structure. Usually, the handle structures are small, and the handle depth should not exceed more than 50% of cup depth. The handle part of the pattern generates interest in buyers as they expect the pattern to brea kout from these levels. The pattern is valid only if price convincingly breaks out with increased volume above the rim of the cup levels (see chart below).
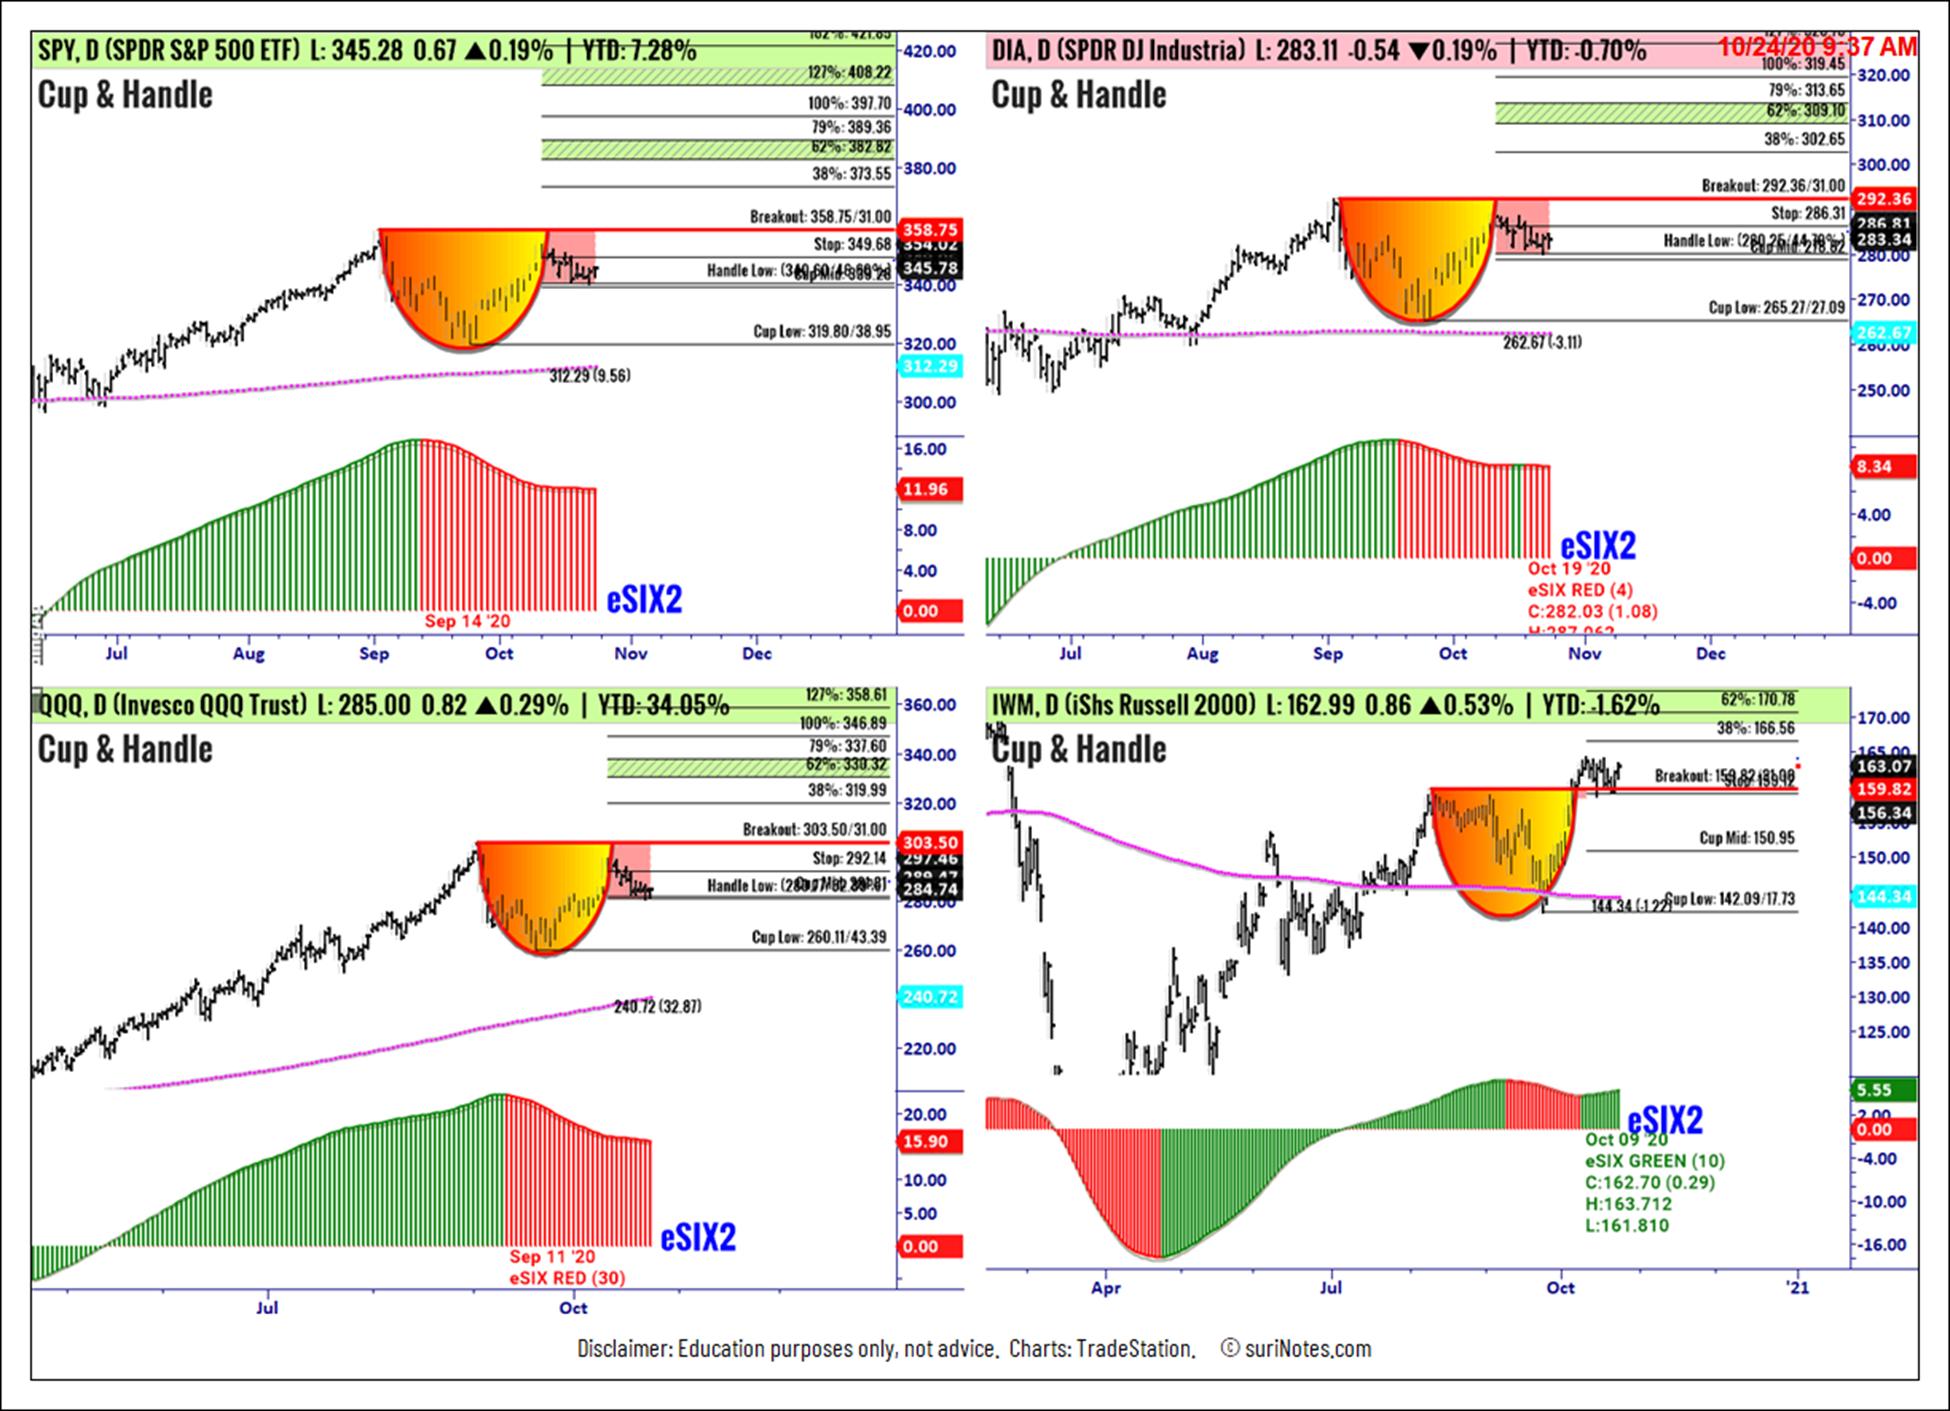
SPY Cup-&-Handle Pattern:
S&P 500 ETF (SPY) is forming a cup-&-handle pattern on its daily chart and trading near the breakout level of $358.85. C&H patterns are valid only when the price closes above the breakout level. A long trade is entered above the breakout level with a stop placed below the lowest low of the mid cup $339.28, and the handle low $340.60. Targets are placed at $373.55, $382.8 to $389.4.
DIA Cup-&-Handle Pattern:
Dow Jones Industrial Average SPDR ETF (DIA) is forming a cup-&-handle pattern on its daily chart and trading near the breakout level of $292.46. C&H patterns are valid only when the price closes above the breakout level. A long trade is entered above the breakout level with a stop placed below the lowest low of the mid cup $278.82. Targets are placed at $302.65, $309.1 to $313.7.
QQQ Cup-&-Handle Pattern
Invesco QQQ Trust Series 1 (QQQ) is forming a cup-&-handle pattern on its daily chart and trading below the breakout level of $303.60. C&H patterns are valid only when the price closes above the breakout level. A long trade is entered above the breakout level with a stop placed below the lowest low of the mid cup $281.81, and the handle low $280.77. Targets are placed at $319.99, $330.3 to $337.6.
IWM Cup-&-Handle Pattern
iShares Russell 2000 ETF (IWM) is forming a cup-&-handle pattern on its daily chart and trading near the breakout level of $159.92. C&H patterns are valid only when the price closes above the breakout level. A long trade is entered above the breakout level with a stop placed below the lowest low of the mid cup $150.95. Targets are placed at $166.56, $170.8 to $173.8.
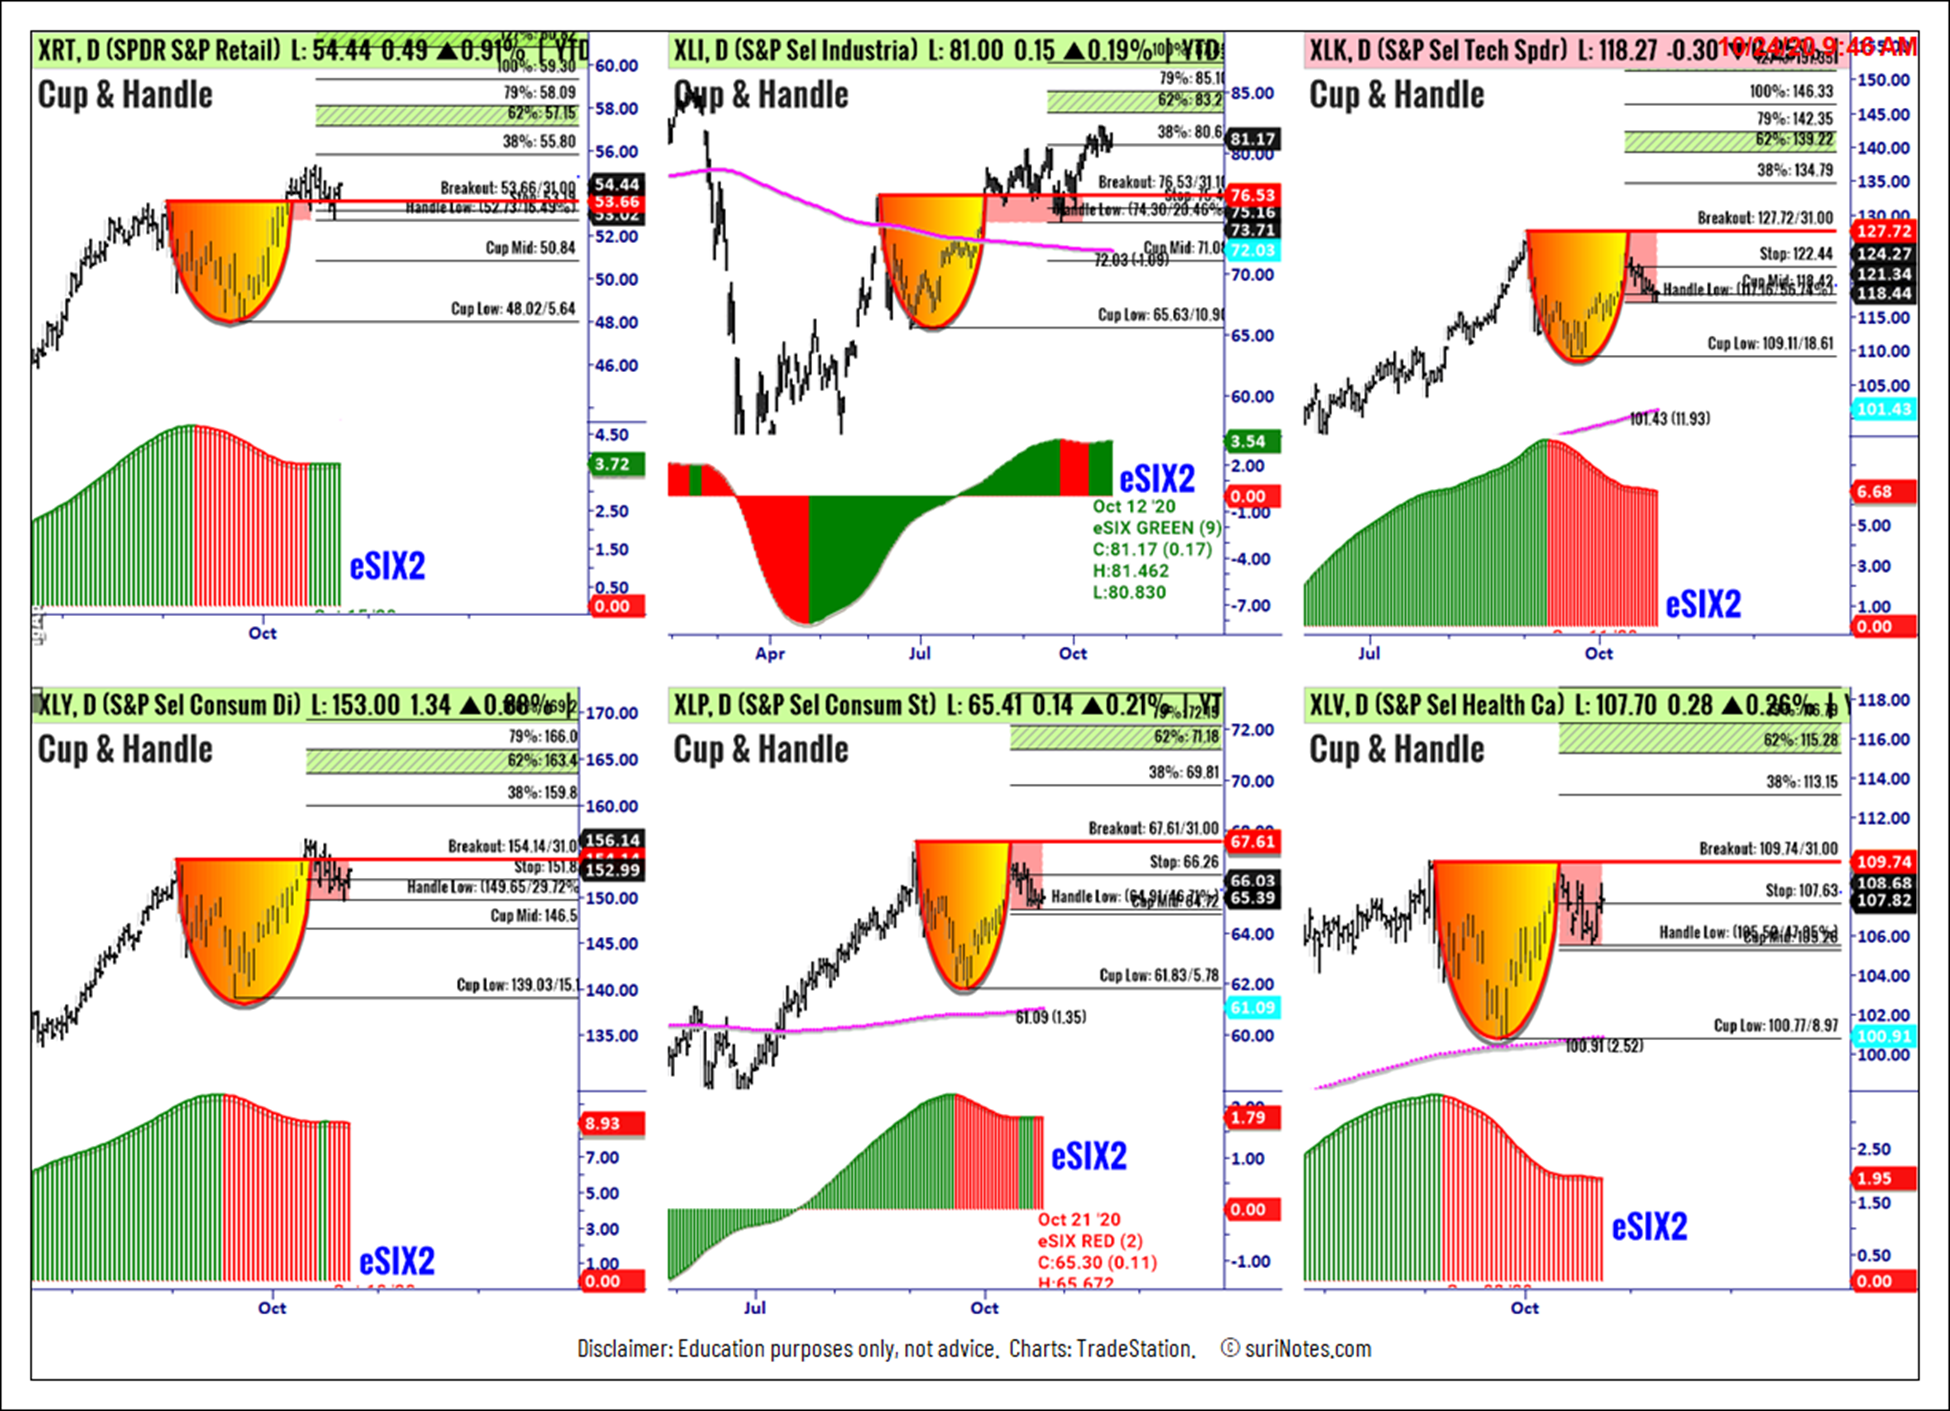
Sector SPDR ETF Cup-&-Handle Chart Patterns
To learn more about Suri Duddella, please visit SuriNotes.com.


