
Not every trade is always going to work out—that’s expected. But what you need to make sure you do is that once you’ve closed that losing trade...you go and look back at it, says Danielle Shay of Simpler Trading.
Try to find what went wrong, where you could’ve improved, and see if there was somewhere you could’ve seen the writing on the wall. Then move on to trade another day.
That way hopefully next time it comes around...you’ll be on the winning end.
So, let’s take a look at a loss of mine in Oracle (ORCL).
I’m frequently asked, “Hey Danielle, what percentage of the time are these setups going to work?” and equally as frequently, “Danielle what do you do when the market gaps down?” So, we're going to start this newsletter off answering those two questions.
Answering the Questions
So, first of all, almost every time I’m selecting a setup, it’s high-probability in nature. I’d say about 70% of the time. So, what about the other 30%?
Well, typically when I’m selecting a chart, I’m going to select it because it has a solid trend, or because it’s in a relative-strength industry group, or because the ticker itself is a relative-strength ticker. I’m also usually selecting the ticker because it has a setup.
For this particular trade, the reason I picked it was because the setup we had was a squeeze.
Now people always ask, “How do you know if it’s going to go up or down?” You never know if it’s going to go up or down...if I knew that, I’d definitely be retired on an island by now. But what we do, is we look at probabilities. We look at how many times it went up versus how many times it went down—we’re looking for the pattern.
But remember, sometimes the pattern breaks.
Oracle’s Previous History
For this trade, you can go back in time and look at how it performed previously. When you do that, which I did prior to taking the trade, you can see that the squeeze fired to the upside multiple times in the past. One could argue and say, “Well it’s fired to the upside so many times in a row, maybe this next time will be the time it fires to the downside.” However, that’s generally not how I trade.
I like to trade with the pattern.
So, I got into this trade with the squeeze setup and the Turbo VZO firing to the upside—it looked to be a great trade. But then it ran directly into resistance. That’s where I should’ve taken my profits off, but I was trying to get the full target at 64, instead of the resistance target at 61.68. Ultimately, I stayed in the trade. I wanted to wait until it pulled back and went to the target a second time.
However, that didn’t happen.
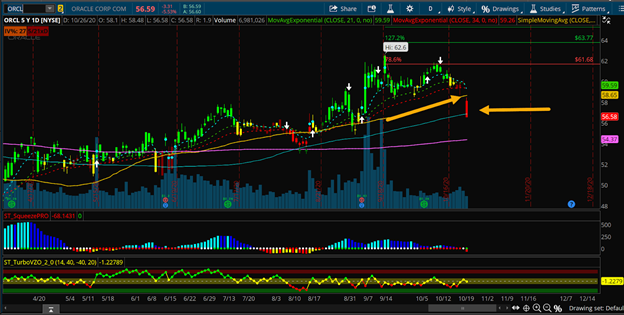
What ended up happening is you can see that the trend strength turbo candles shifted colors on the chart above. They’re a great warning indicator. This shift also occurred on the Phoenix Finder.
You can see how the candles shift from green, to yellow, to red. That is a warning sign that your trade isn’t going in your direction...plain and simple. However, it was possible that in that moment it would hold the 34 EMA and then it would bounce again.
But that didn’t happen...
The Gap Down
Bad news came out about Oracle. It totally gapped down...and you can see how we got a bright red trend strength turbo candle. That’s a confirmation sell signal, in addition to the fact that it gapped down 5% below the 50-period simple.
That's when I decided to take a stop on this trade.
I don’t necessarily take stops when it gaps down all the time, however. I’ve been asked before, “Do you worry about gaps?” It's not that I worry about them. I know there’s a probability that they can happen, but I generally manage them differently. For instance, if it gaps down, and it’s still holding above those key moving averages, then it’s not typically a big deal, and I'll wait for the ticker to bounce.
However, what was different about this gap was that it gapped down below the 50-period simple and it broke the 100-period simple. When you gap down below a key moving average at the 50 SMA, and you have a bright red trend strength candle, that’s a confirmation sell. That’s the moment in time where you want to cut your losses instead of hoping it’ll bounce back.
In conclusion, I had some long calls on Oracle, and I cut them for about a 50% loss.
A lot of the times whenever something like this happens, I’ll get asked, “Well what do you do when you get stopped out?” Simple answer: you move on.
You recognize in the pattern where it went wrong, you take your loss, you walk away, move on, and you live to trade another day.
The lesson from this trade though?
Having really solid indicators can not only make you a lot of money…but more importantly, they can keep you from losing a lot of money.
To learn more about Danielle Shay, visit SimplerTrading.com.


