
Is a blow-off top setting up? Our research team has become increasingly concerned that the US Fed support for the markets has pushed price levels well above true valuation levels and that a risk of a downside price move is still rather high, notes Chris Vermeulen, editor of The Technical Traders.
We understand that everyone expects the markets to go back to where they were before the COVID-19 virus event happened — and that is likely going to happen over time.
Our research team believes the disruption of the global economy over the past 70+ days will result in a very difficult Q2: 2020 and some very big downside numbers.
Globally, we believe the disruption to the consumer and services sector has been strong enough to really disrupt forward expectations and earnings capabilities.
We’ve been warning our friends and followers to be very cautious of this upside price trend as the Fed is driving prices higher while the foundations of the global economy (consumers, services, goods, and retail) continue to crumble away.
Our biggest concern is a sharp downside rotation related to overvalued markets and sudden news or a new economic event that disrupts forward expectations.
Although it may seem impossible to fight the Fed, we believe the markets (like nature) are almost impossible to fool and control. We believe that price will react to market conditions and that future price rotation (both up and down) will continue to be more volatile than many traders expect.
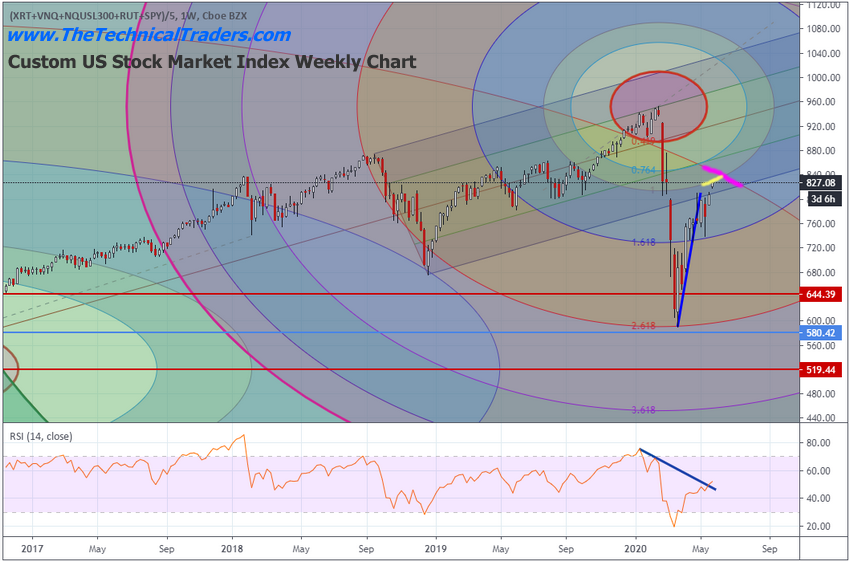
Meanwhile, our Weekly Custom US Stock Market chart below highlights two very important levels related to our Fibonacci Price Amplitude Arcs. These arcs represent critical Fibonacci support and resistance levels that arc across time and price levels
It is important to understand these levels will present very real inflections in price — at least we expect them to create price inflections.
Currently, there is the YELLOW Fibonacci price arc on the chart below that is acting as resistance near the current highs and the MAGENTA Fibonacci price arc that is much longer-term.
This longer-term Fibonacci price arc may be stronger than the current shorter-term arc. Our researchers believe the current Fibonacci arc levels on this chart will prompt price to “flag out” in a sideways price channel before potentially breaking downward.
As we continue to watch for weakness across these charts and trends, we urge skilled technical traders to be prepared for a sharp spike in volatility over the next 4+ weeks.
It appears we are only 2 to 4+ weeks away from reaching these major price inflection points. Currently, we believe a downside move is the most probable outcome.


