After the recent carnage in the stock market, it seems that a test of a critical long-term support level is coming soon, which could provide footing for a bottom and give way to an upward reversal into year end.
Only five short months ago the S&P 500 was trading at the 2011 highs around the 1,370 price level on the S&P 500 index. Since then, the price action has devastated investors and traders alike. As of the close on Monday, October 3, the S&P 500 had worked over 270 handles lower in five months. The price action since September 27 has been a bloodbath.
It is true that the S&P 500 could be carving out a double bottom on the daily chart, but I am of the opinion that there may be more work to do to the downside. We are oversold on the daily and weekly price charts, but I have yet to see the kind of panic-level selling that typically precedes a price reversal.
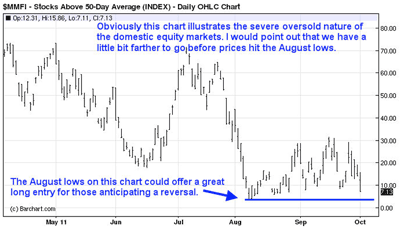
The chart below illustrates the number of stocks that are currently trading above the key 50-period moving average:
While most market participants are concerned about a trap door that causes prices to cascade lower, I am concerned that at some point news will come out that could rip the bears’ faces off.
The majority of retail investors are running for cover. The sentiment levels are decidedly bearish and the last thing most traders are looking for is a rally. The contrarian trader in me cannot deny that a rally would do a lot of damage in the near future, but Mr. Market needs to suck in a few more bears in order to do the most harm.
One sound bite out of Europe could alter the price action almost instantly in favor of the bulls. The European Central Bank (ECB) could suddenly cut interest rates or announce that Eurobonds are going to be made available. Either of the two headlines or a combination of both would most likely drive prices significantly higher.
After the last nasty downside move, there are layers of buy stops above current price levels. If price worked high enough, the stops would be triggered and an all-out rally could play out. Anything coming out of the Eurozone that appears to be either stimulative or that appears to push an ultimatum out on the time spectrum will be viewed as positive.
Often, news and price action play out together at key support/resistance levels, and it would make sense that some form of announcement will be made when the S&P 500 price is sitting right at a long-term support level.
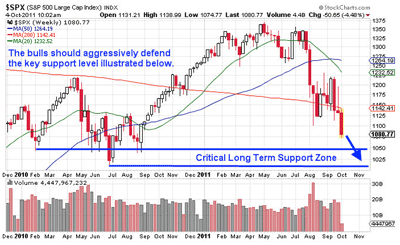
As can be seen from the weekly chart of the S&P 500 index ($SPX) below, the 1,008-1,050 price level is of critical importance.
The primary support levels I am watching on the S&P 500 if it continues lower are the 1,080 price level, which should act as short-term support. If that level breaks, the 1,050 area will become a major support level that bulls will likely defend fervently.
Additional long-term support will come in around 1,008. I would be shocked to see the S&P 500 push through both the 1,050 and the 1,008 price levels on the first attempt, but stranger things have happened.
NEXT: 2 Most Probable Scenarios for S&P 500
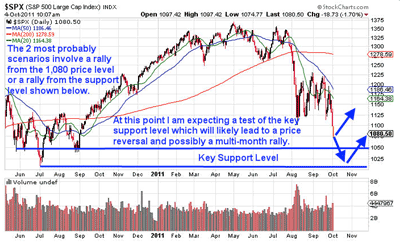
|pagebreak|If price works down to the 1,008-1,050 support zone, it would not be shocking to see a strong reversal higher. With the recent carnage we have seen in the S&P 500, I find it hard to believe that we could see another 10%-15% more downside before a reversal plays out.
The 1,008-1,050 price zone seems ripe for a test, but one other scenario would be a test of the 1,080 support zone that fails intraday and by the close is regained. The chart below illustrates the two most probable scenarios:
Financial markets do not offer a sure thing, however, it is without question that bulls will aggressively defend the 1,008-1,050 price level on the S&P 500. If that level fails, the price action is going to get far worse and an all-out crash could then be underway.
For now, I am of the opinion we are within 7%-8% of an intermediate-term bottom which could produce a strong multi-month rally into the holiday season.
See related: Telltale Signs of Tops and Bottoms
As always, anything could happen, but traders need to keep their eye on both sides of the price action. A rally would do a lot of damage to the bears, as well as the underinvested retail traders and investors.
Ultimately, the price action is in the hands of Mr. Market, but it is a well-known fact that Mr. Market likes to trap traders and inflict pain on as many market participants as possible. A forthcoming rally would offer yet another opportunity for a lot of traders to eat another slice of humble pie.
The prevailing universal sentiment is neutral to bearish by advisors and the general investing public. Who can really blame them given the Eurozone mess, the potential bank contagion collapse effect, and the weak economic trends both in the US and overseas. However, the work I do is almost entirely behavioral-based analysis looking at crowd or herd behavioral patterns.
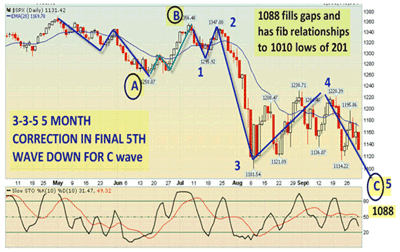
Right now, things are adding up to a market bottom as early as October 7-11 and no later than October 28. The figures I have had for a long time are 1088 for a bottom with a possible worst-case spillover of 1055-1062 in the S&P 500 (SPX) (SPY).
We are already eyeing the gold stocks (and ETFs like SPDR Gold Trust (GLD) and Market Vectors Gold Miners ETF (GDX)) as bottoming out as well and have begun to nibble and will add on further dips.
NEXT: 6 More Signs of an Impending Market Bottom
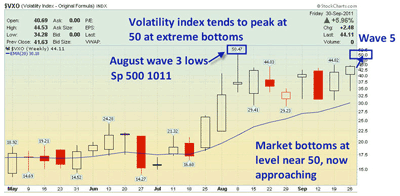
|pagebreak|Let's examine some of the evidence and look the charts as well. Below are two charts (SPX and VXO) showing two likely outcomes in the S&P 500 index in the coming several days to few weeks:
- Sentiment in recent individual investor surveys had only 25% of those polled bullish. Historically that average is 39% or higher
- The CBOE Volatility Index (VIX) and OEX Volatility Index (VXO) have been pegging the 43-45 window recently, and historically, markets have major reversals anywhere from 45-50, with rare cases of that index going over 50 without a major reversal
- The German DAX index is carving out what looks like a bottom channel, and if it can hold the 5300-plus ranges, it could be a leading indicator of a US stock market run
- Seasonally, markets tend to bottom in the September-to-October window with favorable patterns from November into March/April
- Historically, markets tend to correct hard with a "New Moon in Libra" which occurred last Tuesday, the same day the market peaked at 1196 and rolled over hard. They often bottom with the following full moon, which is scheduled for October 11
- Elliott Wave patterns I use indicate we are in the final fifth-wave stage since the 1370 Bin Laden highs, with a gap in the S&P 500 chart at 1088 from September 2010 still to fill. That gap happens to coincide as 78.6% Fibonacci retracement of the 2010 lows to the 2011 highs. It also has a 50% Fibonacci correlation with the 1356 high to 1101 swing move this summer.
Trading Conclusion
Bottom line is the SPX has withstood a ton of pots and pans and bad news over the past eight weeks. The market tends to price in a soft patch in the economy way before it becomes evident in the data.
To wit, when we topped at 1370 in May of this year, it was an exact 78.6% retracement to the upside of the 2007 highs to 2009 lows. The pullback to 1101 is an exact 38% Fibonacci retracement of the 2011 highs and the 2009 lows.
Markets are not as random as everyone thinks, and if you can lay out a roadmap in advance and understand where key pivots are, you can swing the opposite direction of the herd and profit quite handsomely. We generally look to go against the crowd.
By David Banister of Market Trend Forecast and JW Jones of Options Trading Signals


