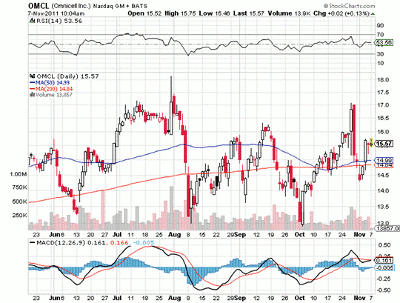
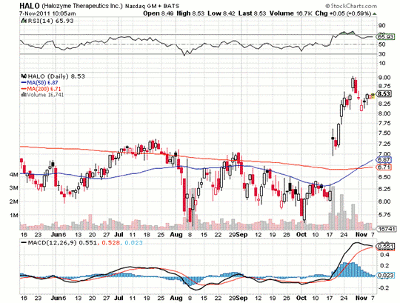
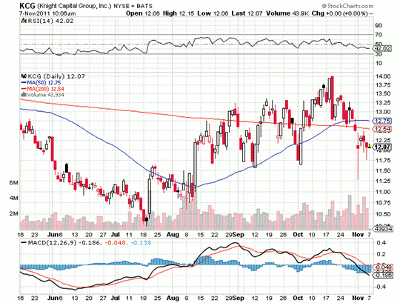
The charts for these three company stocks show very bullish golden cross patterns, not only indicating sharp recent price appreciation, but potentially signaling sustainable upside potential ahead.
The “golden cross” is a technical indicator in which a stock’s 50-day moving average (MA) crosses above its 200-day MA, indicating recent momentum to the upside. When stocks exhibit this sign, it indicates that the upside momentum may persist.
See related: Golden Cross: Reliable in Any Market
We ran a screen on stocks exhibiting the golden cross for those trading at steep discounts to their analyst target prices.
Because target prices are notoriously inflated, we only used the most pessimistic (lowest) target prices, and for stocks with sufficient analyst coverage, we only screened for stocks with five or more analyst ratings.
Do you think these stocks will soon meet their targets? Use this list as a starting point for your own analysis.
List sorted by potential upside implied by target price.
Omnicell Inc. (OMCL) offers automated solutions for hospital medication dispensing and supply management primarily in the United States and Canada. The stock has a market cap of $489.48 million.
Of the seven analysts that have set a target price on the stock, the lowest price target stands at $19.00. This implies a potential upside of 28.64% from current levels around $14.77.
The stock is a short squeeze candidate, with a short float at 5.91% (equivalent to 9.31 days of average volume). It's been a rough couple of days for the stock, losing 7.28% over the last week.
NEXT: 2 More Stocks with Clear "Golden Cross" Formations
|pagebreak|Halozyme Therapeutics, Inc. (HALO) engages in the development and commercialization of recombinant human enzymes that transiently modify tissue under the skin to facilitate injection of other therapies or correct diseased tissue structures for clinical benefits.
The stock has a market cap of $861.08 million. Of the eight analysts that have set a target price on the stock, the lowest price target stands at $10.00. This implies a potential upside of 20.34% from current levels around $8.31.
The stock is a short squeeze candidate, with a short float at 5.37% (equivalent to 6.58 days of average volume). The stock has had a good month, gaining 37.58%.
Knight Capital Group Inc. (KCG) provides access to the capital markets across multiple asset classes to buy- and sell-side firms and corporations, as well as offers capital markets services to corporate issuers and private companies primarily in the United States.
The stock has a market cap of $1.22 billion. Of the seven analysts that have set a target price on the stock, the lowest price target stands at $14.50. This implies a potential upside of 17.79% from current levels around $12.31. The stock has lost 5.74% over the last year.
By the Staff at Kapitall.com


