A proven reversal indicator has identified Carpenter Technology (CRS) as a potential candidate, and with strong Fibonacci support immediately below, the buy signal could be just one bar away.
One of the more interesting explorations in the MetaStock software platform is the “Deel oversold reversal screen.” This database screening tool helps locate stocks that are in an extremely bearish posture and also may become suitable buy candidates after a reversal pattern finally prints on the chart.
The idea is to keep a watch list of the stocks generated by the screen and be prepared to put some money to work on the long side once a stock is clearly embarking into bullish reversal mode.
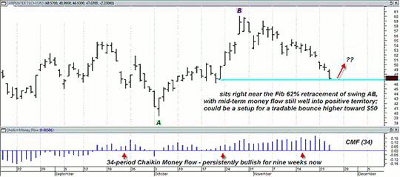
One such stock might be Carpenter Technology (CRS), which was located by the Deel exploration, and while it hasn’t yet put in a reversal pattern, it does have a couple of other attractive technical indications that are clearly biased toward the notion of a tradable bounce higher in the near term.
Here’s a closer look now:
If money flow remains persistently bullish even after a pullback to a significant Fibonacci or chart support level, you may want to keep a close watch for a bullish reversal set-up bar or reversal pattern to form, only going long as the market proves the bullish reversal is for real.
Shares of CRS had a tremendous run higher during October, running from a low of $39.32 all the way to $60 in just 23 calendar days. Not surprisingly, the stock has pulled back and now sits right near the Fibonacci 62% retracement of major swing AB (which in itself is the entire October rally).
See related: Fibonacci Analysis: Master the Basics
This Fibonacci support level (one of the most important Fibs of all) also happens to reside near the level of the prior minor swing low established during October’s strong rally. Another bullish aspect here is the very solid medium-term Chaikin money flow (CMF)(34) histogram; note how persistently bullish it’s remained since mid-September 2010.
Really, what traders need to watch for now is a reversal bar. These can come as a single-bar reversal that initiates a tradable rally, or they can come as a multi-bar reversal pattern that also can act as a launching pad for a decent swing bounce profit opportunity.
If you see CRS open lower (perhaps even with a gap) and then the stock quickly reverses and gains a dollar or two that day, closing near the highs of the day and perhaps even above the previous trading session’s high, well, you’ve probably got a real reversal bar set-up underway.
The next step is to consider going long on a buy-stop trigger above the reversal bar’s high, making sure you’re not taking on too much risk for the size of your account. Since you won’t know how far the bullish reversal will travel, you may want to establish a short-term price target and then close out the trade as soon as it’s hit, rather than trying to hold out for one of those all-too-infrequent major trend-following moves that never seem to show up when you really need them!
By Don Pendergast of Linear Trading Systems, LLC
Donald Pendergast is a trading systems developer and owner of Linear Trading Systems, LLC. He currently has four E-mini stock index and/or silver futures trading systems available for auto trading at Striker Securities in Chicago, IL and two E-mini S&P 500 systems at the TradeStation Strategy Network. He also offers futures trading systems for sale to individual traders and institutions.


