Brandon Wendell of Online Trading Academy explains how to use a sentiment indicator that helps traders see market direction.
Traders are facing increased volatility in the markets these days. Wouldn't it be nice to have an extra odds enhancer that could help you identify when there is a higher probability of a rally day or a pending selloff?
As traders, we look to the mistakes that novice traders and investors make and try to take the opposite side of the trade in order to profit.
One of the ways we can identify those mistakes is by observing when extremes have been met in sentiment. Usually, when everyone who wants to buy has entered a bullish position in the markets, the demand has been satisfied and it will be extremely difficult for prices to continue to rise. This may lead to a selloff that triggers stops and accelerates downward.
The same phenomenon occurs after a panic selloff. If everyone has dumped their supply on the markets at about the same time by selling or shorting, then the markets will be exhausted of that supply and start to rise as bargain buyers step in. The rise in price triggers a short-covering rally, or remorseful sellers repurchase shares, thus fueling the rally.
One of the ways we can measure extremes in the equity markets is by viewing the put/call ratio. The put/call ratio has long been used as a sentiment indicator to gauge whether investors and traders were becoming too bullish or bearish on the markets. If too many people were buying puts over calls, then the stock may be oversold and poised for a bounce.
See related: One Indicator Stock Traders Must Follow
The International Securities Exchange (ISE) has an indicator that we can use. The ISE Sentiment Index (ISEE Index) is a sort of put/call ratio with a twist. The ISEE goes a step further and only counts new puts and call positions being opened by small investors and traders. It ignores current open positions to find the current sentiment in real time.
The ISEE also filters out institutional positions so the data does not become skewed by them, hedging positions instead of taking advantage of a potential market move. Remember, an institution buying puts may not be bearish, but it wants to protect a major long position, or may even sell calls to reduce cost basis.
NEXT: Get Clear Signals from the ISEE
|pagebreak|The majority of "dumb money"-small investors, traders, people we know as "the herd"-is usually wrong at major turning points. We can use the ISEE to determine when the bullish or bearish "dumb money" sentiment has become so great that the market may be at a turning point.
If the ISEE closes at an extreme level, it usually marks a reversal point in the market. Remember, it may not be immediate, but it usually occurs shortly after the extreme, unless prevented by Fed actions, major news affecting the market, or acts of terrorism.
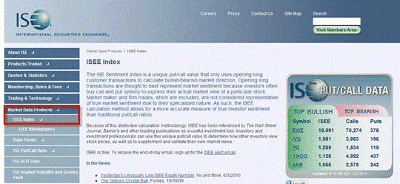
In order to read the ISEE, you will go to the International Securities Exchange Web site at www.ise.com. The ISEE is found by clicking the link on the left side of the home page.
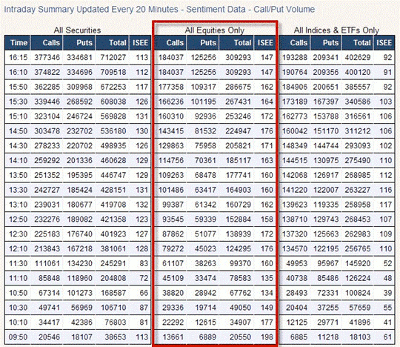
To filter out ETFs that profit from inverse movements, we will look to the middle section, which is labeled "All Equities Only."
The low-level reading is a close below 100. Remember, the intraday data is nice, but the closing value is the most important. If you see a close below 100, expect a broad market rally.
The high reading is 200. If you see the closing value on a given day is over 200, expect a selloff in the markets.
|pagebreak|Pretty simple, isn't it? I wish it were. While the index can work well, we must never deviate from our studies of supply and demand to drive our trading decisions. The ISEE can give false signals, as any other indicator is likely to do as well.
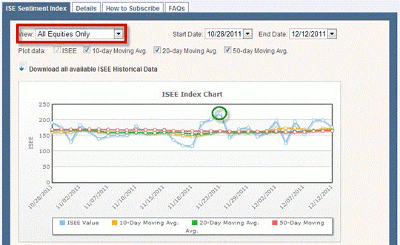
Well, there are some related articles on how to use the indicator in a more advanced manner on the ISE Web site. You can also go to the Market Data and Trading Tools tab on the left side of the page and see more information on the ISEE. You can even get a chart of the index including moving averages.
Notice that I changed the view settings to "All Equities Only." I also highlighted the most recent close above 200, which occurred on November 23, 2011 (green circle). What did the market do after that close?
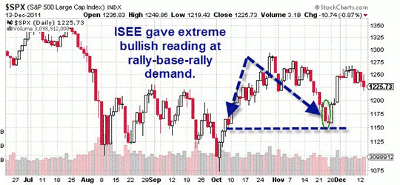
Looking at the following chart of the S&P 500, we see that the market put in a short-term bottom at that point. We should have expected a selloff, but in this case, the traders were right in going bullish near demand and a rally ensued.
I hope you enjoyed learning about this indicator, and please contact me or any of our excellent instructors at Online Trading Academy if you have further questions or need assistance in becoming the best trader you can be. Until next time, may all of your trades be green and your losses small!
By Brandon Wendell, instructor, Online Trading Academy


