Donald Pendergast of Linear Trading Systems takes a daily and weekly look at a popular indicator stock.
Sometimes, it almost seems that a stock goes into a major decline without there being an obvious, specific catalyst, and although it is true that earnings growth rates in stocks do play a major role in moving stock prices higher or lower (and not always in a straight line), and news events also play a part, there is always a dominant price cycle (or multiple cycles) hard at work in all freely traded, liquid stocks that actually is the best determinant of where prices are likely to go in the future.
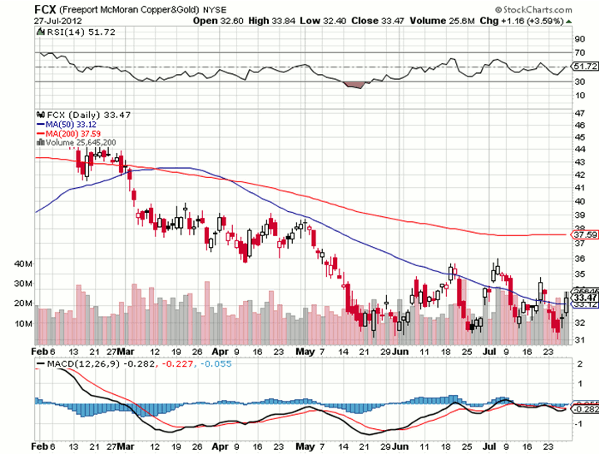
Freeport McMoRan Copper & Gold (FCX) is always a fascinating stock to analyze and trade, not only because of the powerful, sustained trending and/or swing moves it's capable of making, but also because the stock acts as a leading indicator for not only the precious metals sector, but also for the health of the US economy. Here's a look at FCX's daily chart now:
FCX has been the subject of several popular mainstream media articles in recent years, with this volatile large-cap stock never failing to fascinate those who study price charts, cycles, and other technical and fundamental market dynamics.
Next: The Stocks Decline
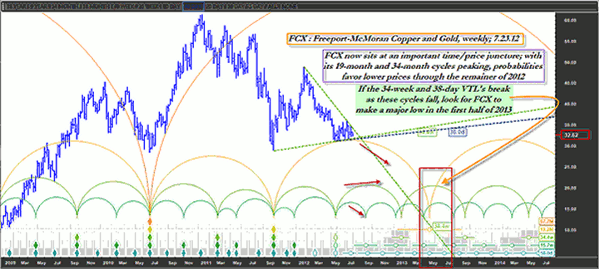
|pagebreak|The stock had a large-scale decline from early January 2011 until October 2011, and then staged a minor rebound into early 2012 before declining once again. It's now consolidating even as its 19-month cycle (orange semi-circle) is peaking, and looking as if it's ready to begin its final approach toward a mid-spring 2013 multi-cycle low on the weekly chart.
The triggering event for this anticipated decline will at least partly depend on when/if the 38-day and 34-week valid trendlines (VTLs; see dashed lines on chart) breaks.
Now, before you start shorting FCX, please remember that this is the latest long-term cycle forecast for this major metals miners stock and is not necessarily indicative of what may or may not occur in the next four to eight weeks. Several small-scale cycles are beginning to turn up in FCX and the 100-day Chaikin money flow (CMF)(100) is also showing a noticeably bullish price/money flow divergence on its weekly chart.
If this current long-term cycle count is correct, one interesting way to play a substantial decline in FCX might be to purchase LEAPS put options with an expiration date at least six to eight months later than the anticipated spring 2013 multi-cycle low that is depicted here.
For example, a January 2014 LEAPS 30.00 put for FCX is selling for about $6.10 ($610 per contract before commissions and slippage) and has a time decay factor of only $1 per day right now, giving a purchaser some time to allow a sustained downtrend to commence.
If FCX declines below 20.00 (which is my own personal projection) by early spring 2013, this put will profit handsomely and still have a good amount of time value remaining at the time such a major low is finally made. This option is out-of-the-money (OTM) and currently has a delta of only -0.35, and that means you also have some staying power in the event FCX stages a minor rebound rally (because the option will decline in value at a rate that is only 35% of the actual number of points moved by the stock).
It is interesting to note that the further OTM January 2014 25.00 puts have an open interest figure that is more than five times larger than that of the 30.00 puts—266 contracts versus 51 as of this writing. Perhaps some other savvy traders are also looking at various long-term cycle projections in FCX, too!
The 25.00 puts are much cheaper than the 30.00s are; they are selling for $3.85 at the moment. These both look like good, low-risk long put plays in one of the most volatile and trend-worthy stocks in the precious metals mining universe, but no matter how bearish you are on FCX, always remember to limit your risk and use strict trade management techniques.
Donald Pendergast is a trading systems developer and can be found at Linear Trading Systems.


