Corey Rosenbloom highlights why this trade went the wrong way, what clues signaled the reversal, and how traders could have profited on the turnaround.
As traders, sometimes we learn more from failed trades than successful ones, underscoring how important it is to review your trades for as much information as possible.
I wanted to highlight a great example of how to switch gears and adapt when price does something unexpected, which can lead to profitable trades in the new "unexpected" direction. August 20’s intraday market gave us a great example of this concept, so let’s take a look and learn the lesson from price.
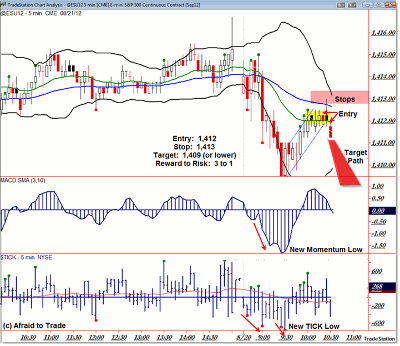
Here’s the S&P 500 futures chart on the five-minute time frame setting up a classic retracement (flag):
Let’s discuss the classic short-sale retracement set-up that developed near 10:30am CST in the ES Futures (which just as easily could be the SPY or any related leveraged index ETF).On the open of August 20, the S&P 500 sold off with a downward impulse accompanied by new momentum (3/10 Oscillator) and TICK (Market Internal) lows (a confirmation). This suggested that odds favored new price lows yet to come in the context of a potential new intraday/short-term downtrend.
An ideal trade is to short-sale the first reaction (retracement) up into resistance such as the 20 or 50 EMA (displayed) or a corresponding Fibonacci Retracement level (not displayed).
The retracement from 9:30am to 10:30am took the form of a potential bear flag, and triggered a potential trade entry into 1,412.50 (into resistance) or on the break under the rising bear flag trend line at 1,412.
The logical place to locate an initial stop—in the event this trade failed—was above the 50 EMA and "spike" high into 1,413. The minimum downside target would be a retest of the session low (1,410) or preferably just under the session low (1,409 or lower).
The logic and classical retracement play triggered, and it was up to the market either to complete the trade or fail. It’s important also to note the “pocket” or concentration of stop-losses logically placed above 1,413.
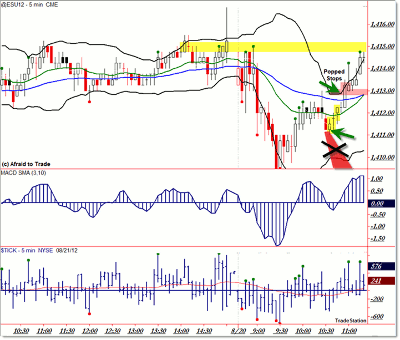
Per IF/THEN logic, we would expect price either to fulfill its downside target, or else IF price traded above 1,413’s resistance, THEN we could expect a surge of buying pressure due in part to “Popped Stops” or “buy-to-cover” orders from the short sellers in the position.
|pagebreak|Here’s what happened immediately after the trade triggered:
What went wrong? First, let’s remember that any trade set-up—no matter how many indicators align—is still just a probability of success, not a certainty. Any trade could fail, but there’s a special insight we can learn from high-probability trades that fail—that’s what we’ll focus on here.
There’s a statement that I repeat frequently to Idealized Trades members, and it’s very applicable in this instance: “IF something should happen but does not, THEN it often leads to a larger than expected move in the opposite direction.”
In other words, if traders collectively expect price to move one way (in this case, lower), then in the event it instead moves up, it often forces these traders out of their positions...which is the basis for Feedback Loops like this “Short-Squeeze” or “Popped Stops” example.
In the daily reports, I frequently describe these new opportunities as "Popped Stops Plays," which are aggressive trades that call for entering as soon as price "busts" or breaks a high-probability pattern (especially short-sale retracements).
The aggressive entry takes advantage of the “snowball rolling down a hill,” which refers to the initial stops that are triggered above a known resistance level, which culminates in even more stops triggered as price moves higher through the “pocket.” Remember, traders don’t locate stops at exactly the same levels; the higher price goes, the more stops are triggered.
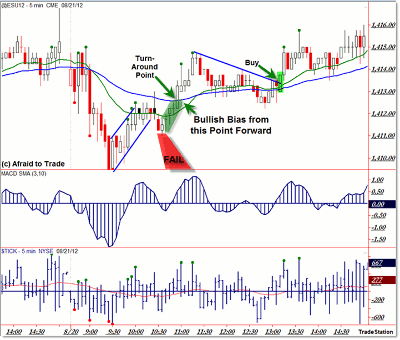
And there’s something even more important than rushing in to buy at the break-point: A failed high-probability set-up, particularly early in the trading session, can provide a major clue as to the bias or expected direction for the rest of the session.
In other words, when the market broke (busted) the sell set-up, price revealed that buying pressure was able to overcome selling pressure, and that this newly revealed imbalance will likely continue for the remainder of the session.
As we can see in the next chart which reveals the rest of the trading day, the busted/failed morning pattern clued us in that odds shifted to the bullish side:
In addition to the immediate “Popped Stops” play (buying the breakout above 1,413, which led to an immediate 2-point gain), there was one more trend line or “flag” style breakout trade that triggered at 1:30pm CST, which also led to a 2-point gain on an otherwise low-volatility bullish range day.
It’s important not to become frustrated or angry when a classic high-probability set-up fails.
Often, the blatant failure of a high-probability classic trade (the logic works the same for support-buy trades that fail) often is a powerful message from price that we should shift our focus and respect the new shift in the supply/demand relationship. At a minimum, it should prevent us from holding stubbornly short when a good trade fails.
A small stop-loss from a high-probability set-up like this often provides valuable information that allows us to profit from the new bullish bias (future direction) signaled by the classic trade that just failed. It should also clue us in to focus our attention on future bullish or buy-trades and against potential short-sale or bearish trades from that point forward.
Corey Rosenbloom is a trader and blogger at AfraidToTrade.com.


