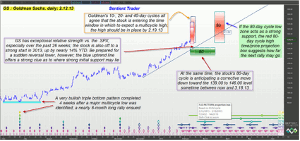
These days, Goldman Sachs is acting less like a vampire squid and more like a ticking time bomb, says Donald Pendergast of SentientTrader.com, and he shows why.
Of all the large cap financial sector stocks, few, if any, trend better than shares of Goldman Sachs (GS) do; since the summer of 2012 GS, is up by nearly 70%, easily outperforming most other component stocks in the S&P 100/500 indexes. But as bullish as Goldman's daily cycles chart appears at first glance, two key technical dynamics are strongly suggesting that GS is probably much closer to the end of this major rally than it is to its beginning. Here's a more in-depth look now.
Between early June and late July 2012, GS put in a super-bullish-looking triple bottom pattern (blue shaded area) at the same time that no less than eight price cycles all made significant lows; note the stack of eight diamonds below the middle swing low of the bottoming pattern—this combined set of technicals was announcing to the market that the potential for a long-term rally was highly probable. Sure enough, GS obliged, surging higher in two separate waves, rarely dropping below its key 50-day exponential moving average (ema) for very long since August 2012.
Today, the stock continues to grind higher on very low volatility, suggesting a sense of complacency among long-term holders of the stock, even as it is now entering a time window in which its 10-, 20-, and 40-day price cycles are all due to peak by no later than February 19, 2013.
GS's price cycles chart depicts this particular time/price projection window (narrow vertical red boxes), and this is something that all current longs in this key financial sector stock need to be aware of. The purchase of put options and the use of appropriate trailing stops—if not actually starting to scale out of the position itself—might be something that current GS bulls want to carefully consider, since it's usually when a stock is trending higher on low volatility that a 'surprise' sell-off appears.
In the case of GS, however, such potential for a sharp correction really should come as no surprise at all, given the anticipated multicycle high, especially since the stock's 34-day and 100-day Chaikin money flow (CMF) histograms (not shown) are both in agreement that a bearish price/money flow divergence is already in place and the fact that the 34-day CMF histogram is at its highest reading in more than 10 years.
Taken as a whole, GS is a stock market version of a ticking time bomb, just waiting for the trigger for the selling to commence. Once this high probability sell-off starts, look for a relatively quick drop down toward the blue uptrend line (near 146.00/147.00); a decline to this level still really won't make for a confirmed 80-day cycle low, however, so there will still be the potential for further declines heading into March 2013. Current cycles projections are for GS to bottom before hitting 139.00 and for the full 80-day cycle low to arrive no later than March 19, 2013.
Unless the broad markets (SPX, ^RUT, and NDX) are all in extremely bearish modes should GS move into the lower 140.00 area, the bottom half of the green 80-day cycle low box may offer an excellent opportunity for the bulls to jump back into the stock for another (probably more modest) rally back up toward the red 80-day cycle high projection zone.
Always be sure to use a proven mechanical entry/exit system, even if you rely on price cycles and money flow studies, as these two technical studies are more useful as a 'big picture' analysis tool than they are as a pinpoint accuracy timing mechanism. But as far as helping a trader/investor to stay on the 'right' side of a given market, it's hard to imagine a better, more effective '1-2' technical punch than the combined power of price cycle and money flow analysis can provide.
Donald Pendergast can be found at SentientTrader.com.


