As a trader, he's drawn to key price or trendline inflection points that generate simple “if/then” strategy planning events depending on how price interacts at a critical reference level, says Corey Rosenbloom of AfraidtoTrade.com.
At the moment, Amazon (AMZN) shares are trading down from a critical inflection point that will set the stage for short-term trading strategies for the stock.
Let's take a quick look at the current inflection zone and note what the expectations will be for channel or pattern continuation or else a breakout above the known resistance/inflection level.
Keep in mind our goal here is not to predict the future, but to note price behavior (supply/demand) at a key inflection point. Trades develop naturally from the higher timeframe structure as we watch the lower frame evolve in real-time.
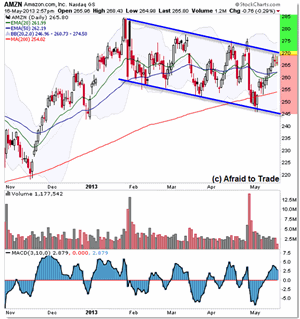
For now, the simple key inflection point for Amazon is the $270 per share level as it reflects the upper bound (target) of a falling range (declining parallel trendline) pattern.
A breakthrough ABOVE this inflection point that carries above the prior “spike” or bull trap high into $275 would be expected to continue through “open air” back to the prior established high into $285 per share.
That's the bullish “if/then” scenario plan. The bearish plan calls for a simple continuation of the short-term pattern, which would suggest a bearish outcome all the way back to the $245 per share level (the lower boundary target).
We'll be following along in real-time comparing evidence as to whether the bearish $245 target or $285 upside breakout target is favored.
For now, odds seem to argue in favor of the downside target given the negative divergences and the two doji reversal candles into the critical $270 target.
When in doubt, or to get additional information from a higher timeframe inflection level, drop to intraday charts:
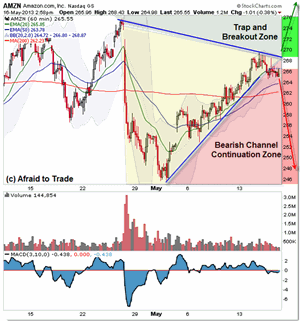
The hourly/intraday chart shows the recent rally up to the $270 target in May, which has been undercut by negative volume and momentum divergences along the way (ever since the volume and momentum peak on May 3).
Again, the chart evidence points for simple odds—at least from an intersection of divergences into resistance—as favoring a bearish outcome.
However, as traders, we are always aware of alternate possibilities if only for risk-management strategies (placing stops above an expected resistance zone). It would be far too easy if everything worked exactly as expected!
Savvy or aggressive traders can also set up a game plan to buy shares on a breakthrough above a resistance level that odds (charts) suggested would hold firm.
The strategy is to trade an unexpected breakout and the expected short-squeeze or popped stops impulse that would likely occur on a surprise breakout.
Thus, we'll plan for a bullish breakout on a firm breakthrough above $270, allowing the one-day possibility of a vicious bull trap (a bull trap occurred on the April 25th high, which preceded a collapse in price the next session).
Otherwise, we'll continue monitoring price should it continue trading lower as the divergences and resistance (daily chart declining trendline) pattern suggests.
If a full downside target is achieved, it will likely do so with a few chances for intraday traders to sell-short intraday bear flag or breakdown trades that occur in real-time as price moves toward the target.
This is an example of scenario planning on the higher timeframe, which guides trading decisions on the lower frame.
By Corey Rosenbloom, CMT, Trader and Blogger, AfraidtoTrade.com


