

Technician Greg Harmon of Dragonfly Capital takes a look at gold from a longer perspective, with the intent of helping to create a high-level road map for the next 12 months and beyond.
That magical yellow rock. It started a movement west, it has been the reason for war. It also has no real use other than its aesthetic appeal. In terms of the markets, it is seen as a store of wealth in crisis and a proxy for inflation, but most of this is myth. Reactions in crisis have been short lived and gold has been rising dramatically through the last 10 years with little or no inflation.
The monthly chart below shows that for 10 years, it did nothing but run higher. But the recent action has been corrective, in fact more than corrective, it has been downright bearish. From a technical perspective, the recent action looks like a bearish motive wave in the Elliott Wave structure. If this is the case, then it would project an end to the wave between $1000 and $800 for gold modeling the Wave V to be between Wave I and Wave III in length. Interestingly this range encompasses the 61.8% retracement of the move higher over that 10-year plus period and the consolidation range in 2008. The 800 level would also be the measured move target lower, if you consider the movement from III to IV a bear flag and now a continuation lower.
The combined effect makes a strong case technically for the range, and for movement lower to continue.
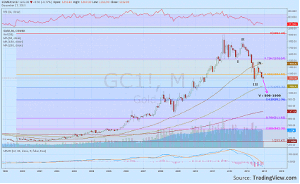
Click to Enlarge
The momentum indicators also support more downside price movement with the relative strength index (RSI) and MACD both pointing lower. With the shiny metal currently at support between 1200 and 1220, a reversal is possible, but not in this chart. The weekly view does not give a goldbug any comfort though. The pattern since 2009 has been a bullish bat harmonic. It is labeled bullish but what it really means is that it expects a bullish reversal, but after the price touches 985. And what about that support area from 1200 to 1220? As it has been consolidating there for a couple of weeks, it now sees the Bollinger bands (a measure of volatility) opening to allow it to move lower. This could even get worse. The bat could morph into a crab, and then the target lower would become $212!!! This timeframe also has the RSI and MACD guiding lower.
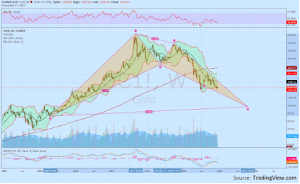
Click to Enlarge
A last ditch review of the daily chart gives the best possibility for hope for gold longs. The falling trend resistance is very near. A rise of only $60 could break the downtrend and start it higher or even just consolidation through time beyond mid-February. All of the simple moving averages are overhead, though, and falling (a bearish sign) and the RSI is rejecting at the mid line, not going into bullish territory.
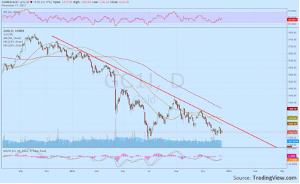
Click to Enlarge
Small hope, but for a reversal higher, gold needs to move above 1280 and quickly. With all the technicals stacked against it, though, the prognosis is for lower prices, and this will become even more confident if the price falls below 1200.
By Greg Harmon of Dragonfly Capital


