From 3-d printing to solar and several in between, these sectors are all worth considering for this year’s portfolio, writes Justin Smyth of NextBigTrade.com.
All of the sectors on the following list show promise for growth and expansion in the upcoming year.
Solar
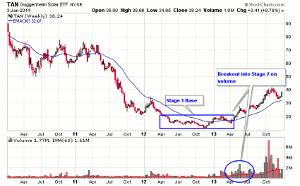
Even though many solar stocks had massive gains in 2013, the solar bull market is still quite young. Most solar stocks began their uptrends early in 2013. So their bull market is barely a year old. Before this year, solar stocks had been in a bear market since 2008 and were basically forgotten and cast aside. They formed a base during most of 2012, which led to the massive breakout in 2013.
Gains at the start of a bull market are usually huge. The gains in solar stocks in 2013 were definitely that of a new bull market. After such big early gains, bull markets usually go through a consolidation period. That could be what is next for the solar space. If solar stocks consolidate high and don’t give back much ground, look for the uptrend to continue going.
The chart below shows the stage analysis of the Guggenheim Solar ETF (TAN). Notice the breakout from a Stage 1 base on increased volume in 2013. The Stage 2 advance is still in its early days, even though many solar stocks have seen huge gains.
Coal
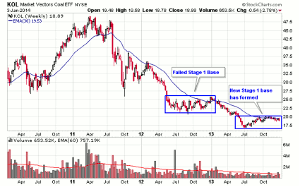
Coal stocks formed a base in mid-2012, and looked like a possible breakout in early 2013. That breakout ultimately failed, and the bear market in coal stocks continued. Most coal stocks put in another bottom in June 2013 and have been basing since then. So coal is basically in a classic Stage 1 and waiting for a breakout on increased volume for a new uptrend.
Coal has a couple things going for it that it didn’t have in 2012. Natural gas finally put in a bottom in mid-2012 and has been rising ever since. Higher natural gas prices will be bullish for coal prices. Many coal stocks are trading at rock bottom valuations, with price-to-book values less than one. Coal stocks are more bombed out than they were at any time in the past decade in many cases. The coal sector is also in a more mature bear market than it was last year, which makes it more likely that the bear market is nearing its end.
Taking a look at the Market Vectors Coal ETF (KOL), notice the failed Stage 1 base in 2012, and the new Stage 1 base that formed in mid-2013. The coal sector is worth monitoring for a breakout into a new Stage 2 advance, which most market participants probably aren’t looking for.
Gold Miners
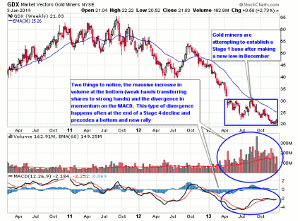
Gold miners got destroyed in 2013. They were basically the worst sector in the market. The price of gold is either attempting to make a double bottom around $1,200 or possibly plunge to new lows in the first quarter of 2014. Whichever happens will have a major impact on gold miners.
The key thing to realize though is the majority of the bear market in gold and gold stocks has probably played out. Both in time and price, gold is now late in its bear market and overdue for a major bottom. Gold stocks could form a Stage 1 base either in the first or second quarter in 2014 and breakout into a new bull market. The gains in gold miners could be massive, as many of them are trading with P/E ratios in the single digits, and book values of less than one. Once the gold price rises, the margins on gold miners will dramatically improve and big money will get attracted to the sector once again.
NEXT PAGE: 4 More Promising Sectors in 2014
|pagebreak|The Market Vectors Gold Miners ETF (GDX) is attempting to move into a Stage 1 base and complete the bottoming process. Notice the positive divergence on the MACD, which often precedes the transition from a Stage 4 decline into a Stage 1 base.
Shipping
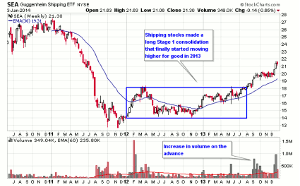
Shipping stocks are similar to solar stocks in the way they have traded over the past five years. After a massive bear market, shipping stocks also bottomed in 2012 with a long Stage 1 base. Then they began to breakout into a new uptrend in 2013. This occurred along with a breakout in the Baltic Dry Index, which is a widely followed barometer of international shipping rates.
Internet Stocks
Internet stocks is a unique sector in the stock market at the current time. A lot of new merchandise has hit the market in this sector in recent years. Everyone knows the big names like Facebook (FB), Twitter (TWTR), Yelp (YELP), etc. There’s clearly still a lot of growth going on in this sector with the number of new IPOs coming out. But these stocks are also expensive in their valuations and pricing in a lot of future growth.
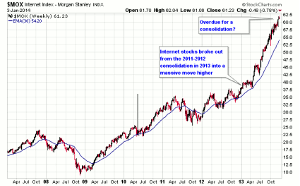
The key thing to realize with these stocks is that they are in a mature bull market. This means the big, early money has already been made. The big money only gets made after corrections or consolidations, such as after the 2008 bear market, or the 2011-2012 massive consolidation. The Internet Index (MOX) shown below hasn’t touched the 30-week moving average since mid-2013, and is likely overdue for another consolidation. This would be the healthiest way for the uptrend in Internet stocks to continue.
3-D Printing
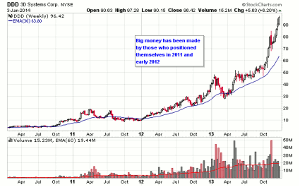
The bull market in this sector has been going on for about two years. The big money, of course, is being made by those that got in on this trend in 2011 and 2012. The public is only now becoming aware of this technology and its potential prospects though. So it’s certainly possible this trend will continue for a few more years. I could see a mania in this sector eventually developing.
Foreign Stocks
The US stock market is very overvalued compared to foreign markets. This is because US markets have outperformed foreign markets for a few years now. This trend can’t continue forever though, and research has shown that buying undervalued markets improves returns when taking a longer-term time frame.
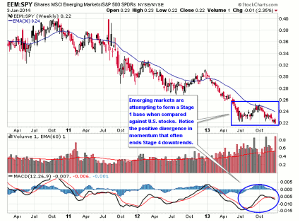
If you take a look at the iShares MSCI Emerging Markets ETF (EEM), for instance, it has been in a bear market since 2011. So that bear market will be three years old in 2014. At some point, the valuation of foreign stocks compared to US stocks will make it such that capital will flow out of US stocks and into foreign stocks. This will propel foreign stocks into a new bull market, and ETFs like EEM will start to break out into new uptrends.
The next chart shows the ratio of the EEM ETF to the S&P 500 SPDR ETF (SPY). What this chart shows is that emerging markets have been weak compared to US markets for three years now, as evidenced by the downtrend in the ratio. What to look for is a Stage 1 bottom in this ratio and the transition into a new uptrend as emerging markets will eventually outperform US markets once again.
Investors may want to take note of these sectors as the market dynamics begin to play out.
By Justin Smyth of NextBigTrade.com


